

NASA & NOAA - Suomi NPP Mission patch.
May 25, 2018
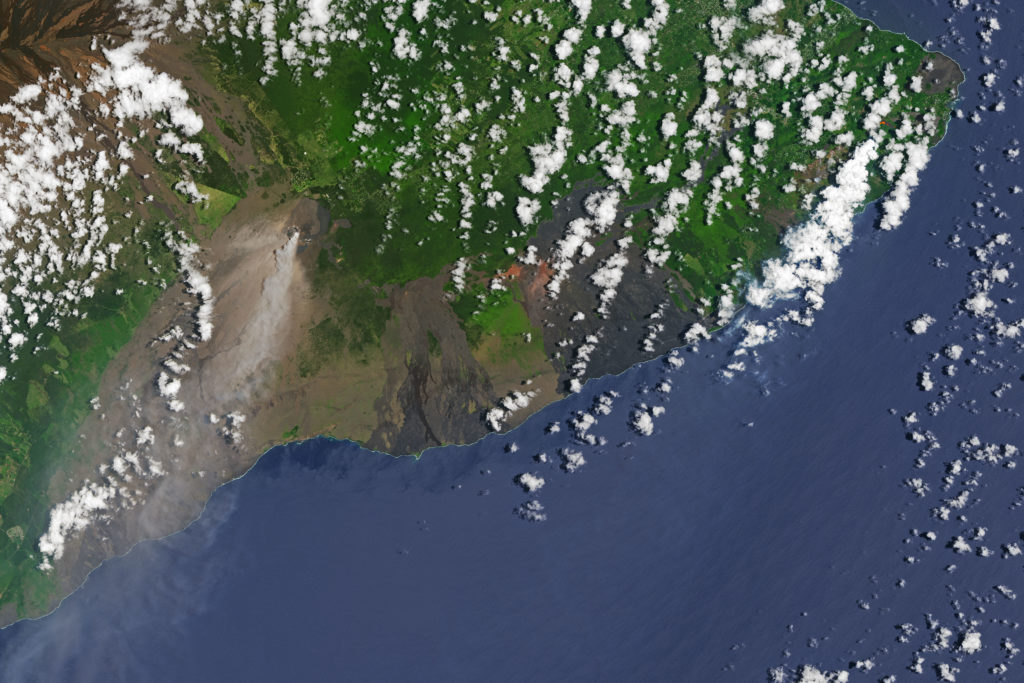
Image above: At 10:41 a.m. local time (20:41 Universal Time) on May 14, 2018, the Operational Land Imager (OLI) on Landsat 8 acquired a natural-color image of the volcano. Image Credits: NASA Earth Observatory.
NASA is tracking lava flows from Hawaii Island’s Kilauea volcano as fissures erupt and lava makes its way to the ocean.
Using data from the Visible Infrared Imaging Radiometer, or VIIRS, instrument aboard the NASA-NOAA Suomi NPP satellite, NASA’s Disaster Program has been tracking thermal anomalies, or hot spots, indicative of lava flow. VIIRS is the only instrument from space that can track lava flows through hot spots, making it an important additional source of information for the U.S. Geological Survey as it monitors and informs the public of the ongoing volcanic activity, which has produced everything from earthquakes and giant rock projectiles from eruptions to blankets of ash clouds and volcanic smog, or vog.

Image Credit: NASA.
For example, VIIRS captured the above enhanced nighttime image on May 14, 2018, superimposed with hot spots highlighted in red. Multiple hot spots were observed on this satellite overpass near the southeast tip of Hawaii Island. Kilauea volcano is represented by the hot spot to the west.

Image Credit: NASA.
Zooming in over this area shows that those hot spots were located farther east from Leilani area and were consistent with new fissures observed on the ground.

Image Credit: NASA.
This VIIRS image from May 22, 2018, shows the extension of the hot spots toward the ocean, indicating that lava is moving toward and warming the ocean upon contact.
In addition to VIIRS, NASA provides other information on volcanic activity, including aerosol and sulfur dioxide measurements derived from the Ozone Monitoring Instrument (OMI) aboard NASA’s Aura satellite as well as the Ozone Mapping Profiler Suite aboard NASA-NOAA Suomi NPP satellite, and ground deformation and movement with synthetic aperture radar data.
NASA also organized a field mission with airborne radar to provide accurate digital elevation maps that USGS can use to predict lava path flows. Flown on the G-III research aircraft, the Jet Propulsion Laboratory’s Glacier and Ice Surface Topography Interferometer (GLISTIN) instrument is detecting changes in Kilauea’s topography associated with the new lava flows, with the goal of measuring the erupted volume as a function of time and ultimately the total volume of the event.
Related links:
NASA’s Disaster Program: http://disasters.nasa.gov/
NASA’s Aura satellite: https://aura.gsfc.nasa.gov/
Ozone Monitoring Instrument (OMI): https://aura.gsfc.nasa.gov/omi.html
Ozone Mapping Profiler Suite: https://jointmission.gsfc.nasa.gov/omps.html
NASA-NOAA Suomi NPP satellite: https://www.nasa.gov/mission_pages/NPP/main/index.html
Glacier and Ice Surface Topography Interferometer (GLISTIN): https://www.nasa.gov/feature/help-from-above-nasa-aids-kilauea-disaster-response-1
Images (mentioned), Text, Credits: NASA/sreiny.
Greetings, Orbiter.ch