
ESA - Sentinel-2 Mission logo.
21 March 2019
Billions of image pixels recorded by the Copernicus Sentinel-2 mission have been used to generate a high-resolution map of land-cover dynamics across Earth’s landmasses. This map also depicts the month of the peak of vegetation and gives new insight into land productivity.
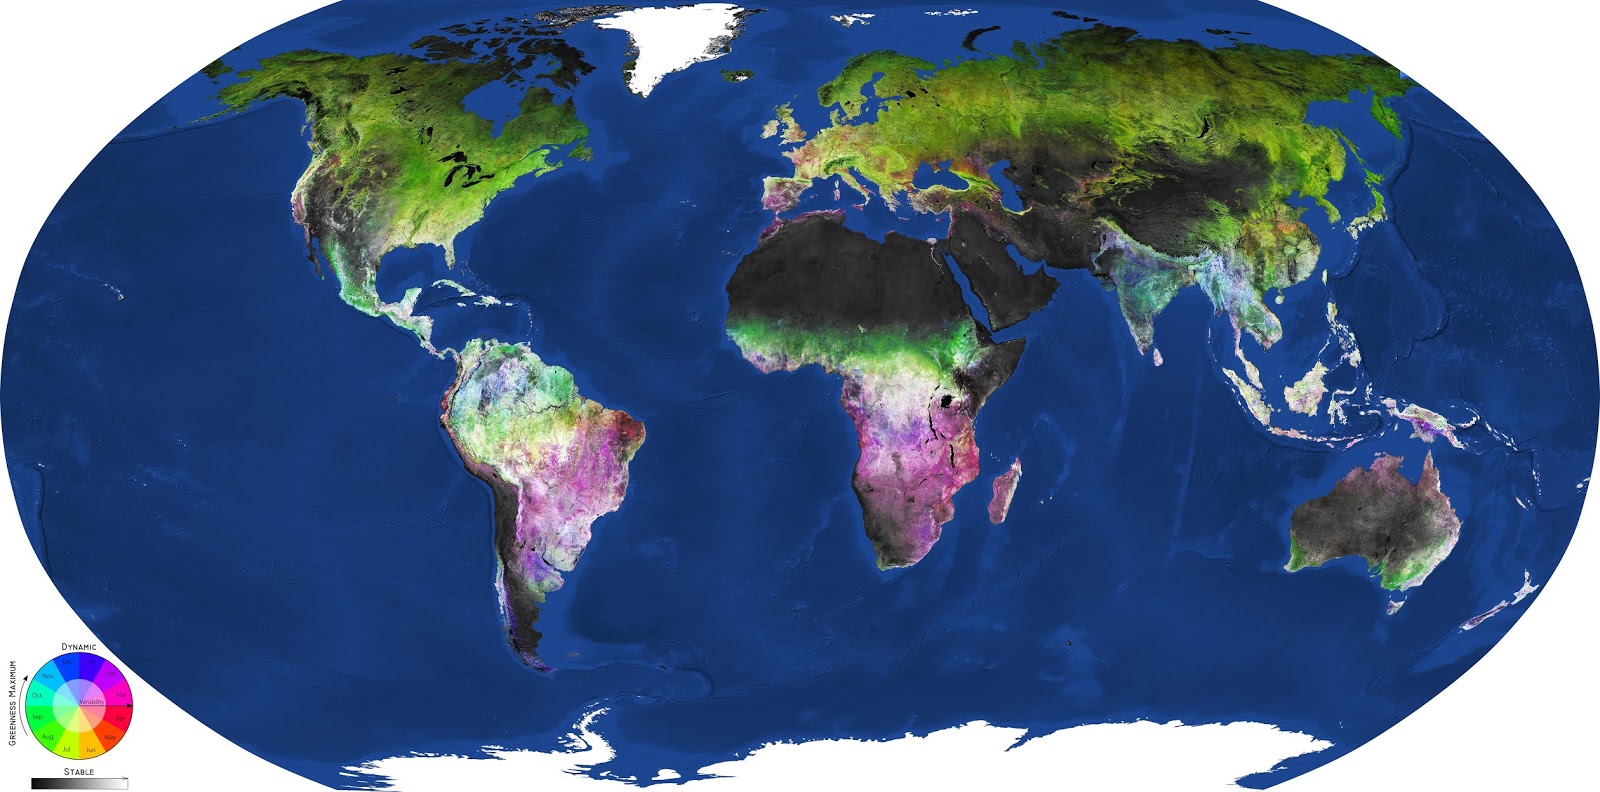
Land-cover map
Using three years’ worth of optical data, the map can indicate the time of vegetation peak and variability of vegetation across seasons. Developed by GeoVille, an Austrian company specialised in the analysis of satellite data, this land-cover map dynamics map uses Copernicus Sentinel-2 archive data from 2015-18, and gives a complete picture of variations of vegetation. The map is displayed at a resolution of 20 m, however a 10 m version is available on request.
It can, for example, support experts working with land-cover classification and can serve as input for services in areas such as agriculture, forestry and land-degradation assessments.
“In particular, we use this as a basis to develop services for the agrofood industry and farmers growing potatoes and other crops, as well as information on how vegetation changes over the year,” explains Eva Haas, Head of GeoVille’s Agricultural Unit.

Swamps and lakes in West Africa
The land-cover dynamic layer was produced with GeoVille’s processing engine LandMonitoring.Earth, a fully-automated land-monitoring system built on data streams from the Copernicus Sentinel-1 and Sentinel-2 missions, as well as ESA third party missions such as the US Landsat.
“Using the system, we processed the complete Copernicus Sentinel-2 image archive along with artificial intelligence, machine learning and big data analytics,” explains Michael Riffler, Head of Research and Development at GeoVille.
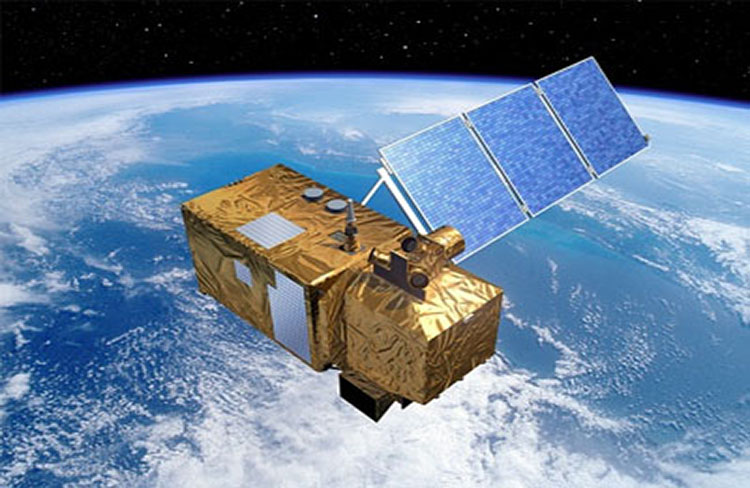
Sentinel-2
“However, the key is the dense time-series of the Copernicus Sentinel-2 data which allows this information to be retrieved for the first time. To date, we have processed more than 23 billion pixels.”
The development has been done through ESA’s Earth observation innovation hub – ɸ-lab, and has been implemented by GeoVille and its subsidiary in the Netherlands – GEO4A.
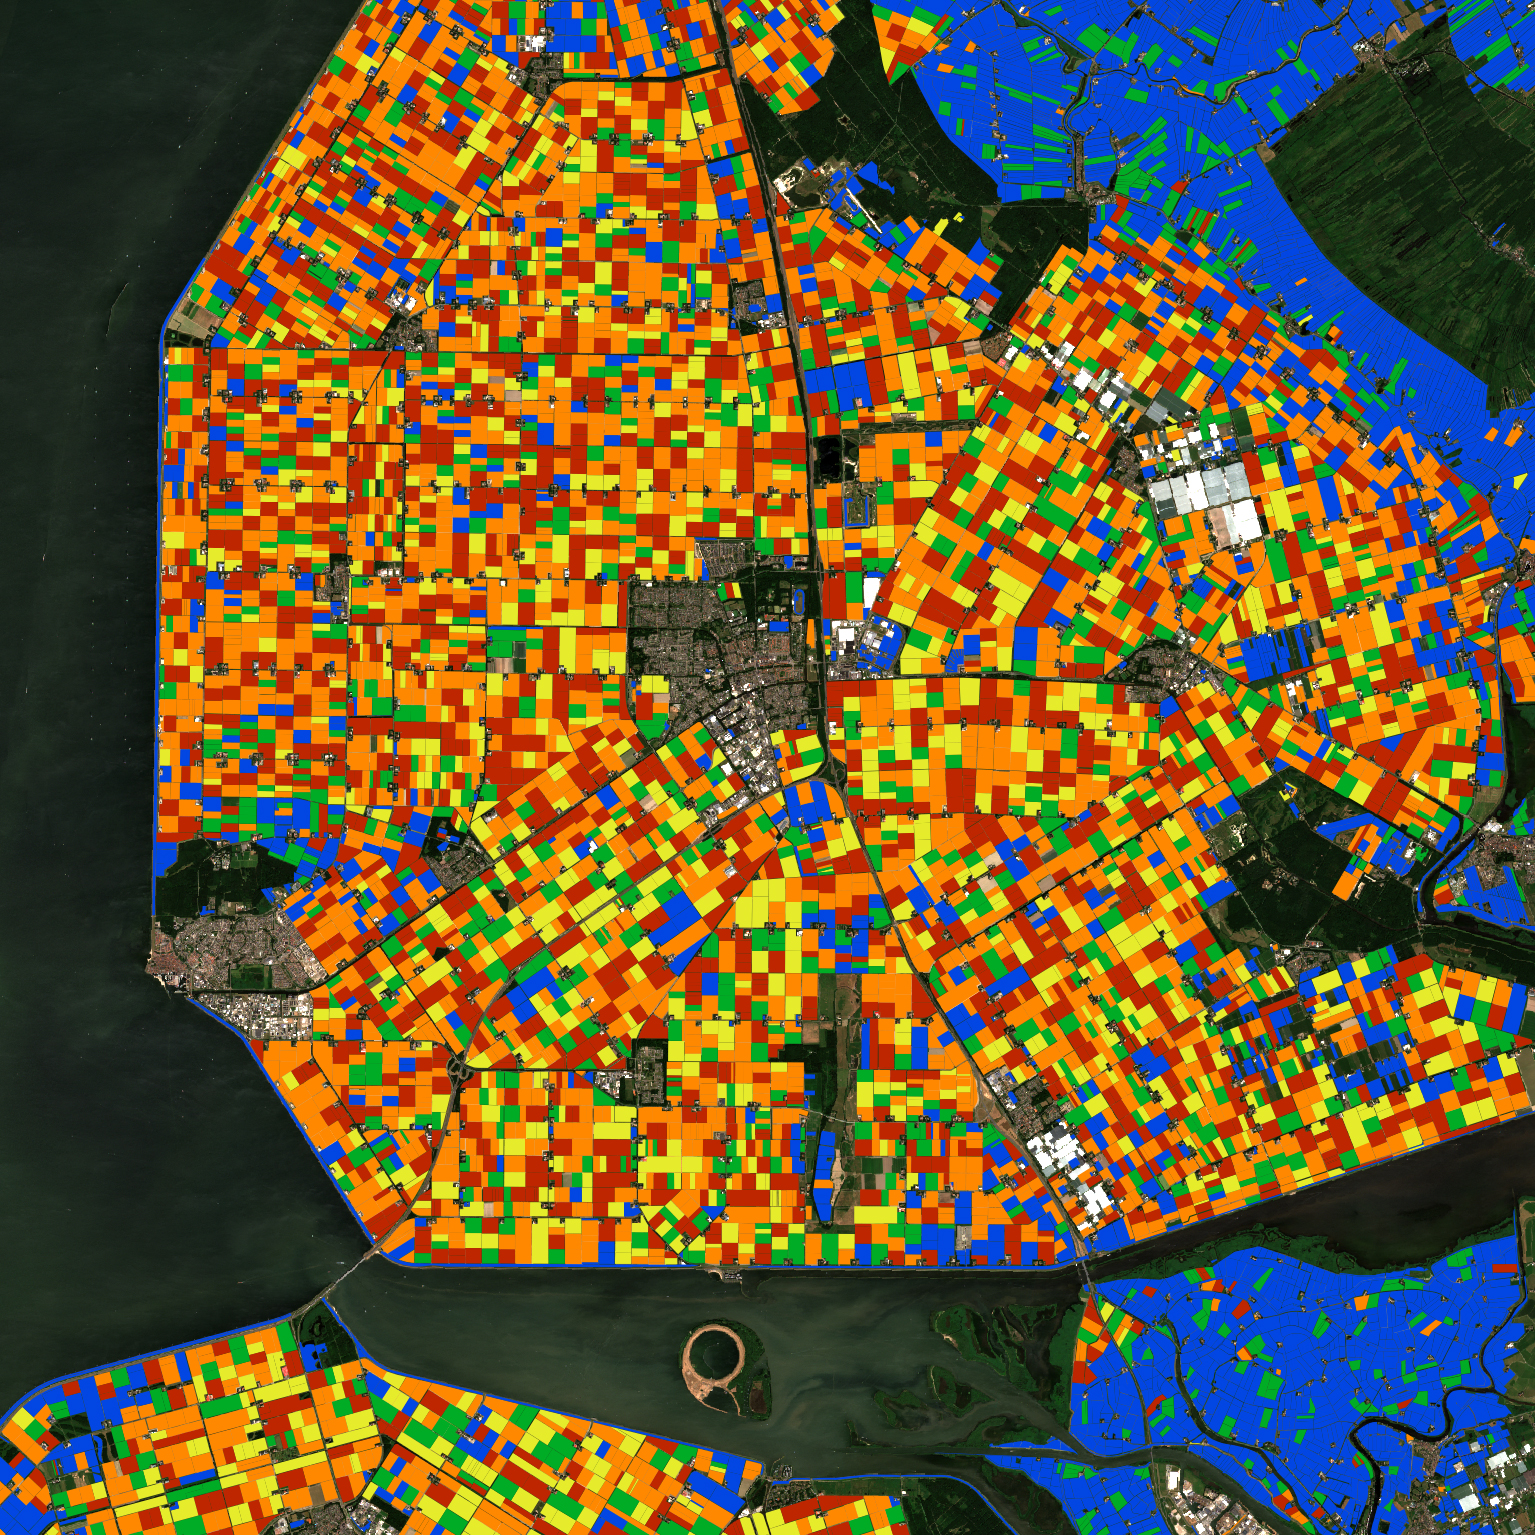
Crops in the Netherlands
“This map forms an excellent foundation for other – more specialised – land cover classifications, whose development and deployment can be further accelerated by applying machine learning and AI,” says Iarla Kilbane-Dawe, the head of ESA’s Φ-Lab in Frascati, Italy.
The LandMonitoring.Earth system is designed to efficiently implement major client solutions such as the European Copernicus Land Monitoring Service products. Experts can specify desired land monitoring data for any place on the globe for any given time period, and receive a quality-controlled output, depending on the required geographic coverage and frequency.
The idea is to make information available to non-experts along with the specific resources and tools that they need.
Related links:
Sentinel-2: http://www.esa.int/Our_Activities/Observing_the_Earth/Copernicus/Sentinel-2
Land Monitoring Earth Portal: https://landmonitoring.earth/portal/
GeoVille: http://www.geoville.com/
GEO4A: https://www.geo4a.com/
Images, Text, Credits: ESA/Contains modified Copernicus Sentinel data (2016–18), processed by GeoVille.
Greetings, Orbiter.ch