samedi 20 juin 2015

Philae resent its news


ESA - Rosetta Mission patch.

June 20, 2015

The European robot that is on the comet "Tchouri" managed to communicate Friday with Rosetta. He had given no news of him for several days.

The laboratory robot, who wake up on June 13 after seven months of hibernation, had succeeded that day for two minutes to communicate with Earth via the probe and transmit data. The next day there was again a contact but of poor quality. Since then he had remained silent. This third contact, lasting 19 minutes, confirms that "Philae is fine," the DLR, the German space agency.

European Space Operations Centre (ESOC) Control Room

To improve communications with Philae, the Rosetta teams escort the comet on its way to the Sun, decided to alter the flight plan of the probe.

Contact was restored Friday between 1:20 p.m. ET 1:39 p.m. GMT (3:39 p.m. 3:20 p.m. ET in Switzerland), says the DLR which is responsible for steering the robot to the European Space Agency (ESA). The robot lab has sent data including module status.

The battery charges

"Now, LG operates at a temperature of 0 degrees Celsius, which means the battery is hot enough to store energy," the DLR.

"This means that Philae will also work at night," says DLR. Recently, Philae working day thanks to its solar panels, but its battery was too cold for charging. On the comet, the day is just over 12 hours.

Philae Lander

The robot, which landed between cliffs and stayed in the shade for several months, also sent recorded data last week. The engineers found that the brightness had increased as the comet approaches the sun. "At the end of the contact, the four solar panels were receiving energy," says DLR.

Philae has ten instruments. Scientists hope it will find such complex organic molecules that could give the keys to the emergence of life on Earth.

The robot has made November 12 a historic first landing on the nucleus of comet 67P / Churyumov-Gerasimenko. He worked for 60 hours before dozing off for lack of sufficient sunlight to allow its solar batteries run.

Related links:

Rosetta Mission: http://www.esa.int/Our_Activities/Space_Science/Rosetta

Rosetta at Astrium: http://www.astrium.eads.net/en/programme/rosetta-1go.html

Rosetta at DLR: http://www.dlr.de/dlr/en/desktopdefault.aspx/tabid-10394/

Ground-based comet observation campaign: http://www.rosetta-campaign.net/home

ESA Rosetta blog: http://blogs.esa.int/rosetta/

Images, Text, Credits: European Space Agency (ESA)/ESOC/ATS/Orbiter.ch Aerospace.

Best regards, Orbiter.ch

vendredi 19 juin 2015

Solar Filaments Arrow -- One Revolution Later


NASA - Solar Dynamics Observatory (SDO) patch.

June 19, 2015


The sun, as seen by NASA's Solar Dynamics Observatory, or SDO, on June 17, 2015, shows the remains of the two solar filaments that appeared to form an arrow, have survived transitioning around the sun, but the sharpness of the shape has degraded since they were first observed on May 28, 2015. Image Credit: NASA/SDO.

Sun Says "Keep Right"


Is the sun trying to send a message? A pair of giant filaments on the face of the sun have formed what appears to be an enormous arrow pointing to the right. If straightened out, each filament would be about as long as the sun’s diameter, 1 million miles long.

Filaments are cooler clouds of solar material suspended above the sun's surface by powerful magnetic forces. Filaments can float for days without much change, though they can also erupt, releasing solar material in a shower that either rains back down or escapes out into space, becoming a moving cloud known as a coronal mass ejection, or CME.

This image was taken on May 28, 2015, in combined wavelengths of extreme ultraviolet light by NASA's Solar Dynamics Observatory, which observes the sun 24 hours a day. Image Credit: NASA/SDO.

For more information about Solar Dynamics Observatory (SDO), visit: http://www.nasa.gov/mission_pages/sdo/main/index.html

Images (mentioned), Text, Credits: NASA/Holly Zell.

Greetings, Orbiter.ch

Pluto and its Moon Charon, Now in Color


NASA - New Horizons Mission logo.

June 19, 2015


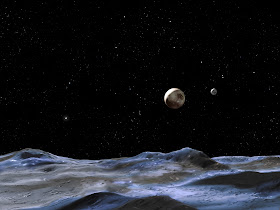
The first color movies from NASA’s New Horizons mission show Pluto and its largest moon, Charon, and the complex orbital dance of the two bodies, known as a double planet.

“It’s exciting to see Pluto and Charon in motion and in color,” says New Horizons Principal Investigator Alan Stern of the Southwest Research Institute (SwRI), Boulder, Colorado. “Even at this low resolution, we can see that Pluto and Charon have different colors—Pluto is beige-orange, while Charon is grey. Exactly why they are so different is the subject of debate.”


New Horizons will make its closest approach to Pluto on July 14, zipping by about 7,800 miles (12,500 kilometers) above the surface. It’s the first mission to Pluto and the Kuiper Belt, a relic of solar system formation beyond Neptune. Sending a spacecraft on this almost 3-billion mile journey will help us answer basic questions about the surface properties, atmospheres, and moons of the Pluto system.

These near-true color movies were assembled from images made in three colors — blue, red and near-infrared – by the Multicolor Visible Imaging Camera on the instrument known as Ralph, a “Honeymooners” reference that classic TV fans can appreciate. The images were taken on nine different occasions from May 29-June 3.

Although the two movies were prepared from the same images, they display the Pluto-Charon pair from different perspectives. One movie is “Pluto-centric”, meaning that Charon is shown as it moves in relation to Pluto, which is digitally centered in the movie. (The North Pole of Pluto is at the top.) Pluto makes one turn around its axis every 6 days, 9 hours and 17.6 minutes—the same amount of time that Charon rotates in its orbit. Looking closely at the images in this movie, one can detect a regular shift in Pluto’s brightness—due to the brighter and darker terrains on its differing faces.


The second movie is barycentric, meaning that both Pluto and Charon are shown in motion around the binary’s barycenter – the shared center of gravity between the two bodies as they do a planetary jig. Because Pluto is much more massive than Charon, the barycenter (marked by a small “x” in the movie) is much closer to Pluto than to Charon.

As New Horizons closes in its intended target, the best is yet to come. “Color observations are going to get much, much better, eventually resolving the surfaces of Charon and Pluto at scales of just kilometers,” said Cathy Olkin, New Horizons deputy project scientist from SwRI. “This will help us unravel the nature of their surfaces and the way volatiles transport around their surfaces. I can’t wait; it’s just a few weeks away!”

The Johns Hopkins University Applied Physics Laboratory (APL) manages the New Horizons mission for NASA’s Science Mission Directorate in Washington. Alan Stern of the Southwest Research Institute (SwRI), headquartered in San Antonio, is the principal investigator and leads the mission. SwRI leads the science team, payload operations, and encounter science planning. New Horizons is part of the New Frontiers program, managed by NASA’s Marshall Space Flight Center in Huntsville, Alabama. APL designed, built and operates the spacecraft.

Ralph is a joint project between SwRI, Ball Aerospace in Boulder, Colorado, and NASA’s Goddard Space Flight Center, Greenbelt, Maryland.

For more information on the New Horizons mission, including fact sheets, schedules, video and images, visit: http://www.nasa.gov/newhorizons and http://pluto.jhuapl.edu

Follow the New Horizons mission on social media, and use the hashtag #PlutoFlyby to join the conversation. The mission’s official NASA Twitter account is @NASANewHorizons. Live updates will be available on Facebook at: https://www.facebook.com/new.horizons1

Image & Animations, Text, Credits: NASA/Lillian Gipson.

Greetings, Orbiter.ch

Solar Impulse 2 grounded for two months?


SolarImpulse - Around The World patch.

June 19, 2015

The solar plane can wait "two months" there, said Thursday its pilot André Borschberg. The solar plane is blocked in Japan by the rains after a breakdown.


Image Above: Solar Impulse 2 can wait "two months" there, said Thursday its pilot André Borschberg. The solar plane is stuck in Japan by the rains after a breakdown.

"Of course we are willing to wait for a good window (weather), but inevitably there is a limit," told reporters Mr Borschberg. The pilot was asked about the maximum duration of grounding of the solar plane in Japan.

"I hope that in the coming days, say within two weeks, we will find the window to fly to Hawaii. Obviously, we intend to fly this summer, "said the pilot of 62 years, considering that his team could wait" maybe two months "in Nagoya.

"In the worst case, if we do not have a weather window, we may need to wait until next spring," he added, however.

Short Term Forecast

According to André Borschberg, weather forecasts are "beginning to not be reliable beyond five or six days." "That's what makes it very difficult flight. We do not want to risk too much," he reiterated.


Image Above: Solar Impulse 2 is the last two weeks away in his protection tent in Nagoya, where he had to stop due to bad weather.

Solar Impulse 2 was forced to make a stop on June 2 in Nagoya where bad weather has damaged. There is repaired but it has been waiting for a favorable weather window to leave Japan.

The rainy season has started since early June in Japan and is expected to further extend several weeks.

For more information about SolarImapulse Around The World, visit: http://www.solarimpulse.com/

Images, Text, Credits: SolarImpulse/ATS/Orbiter.ch Aerospace.

Best regards, Orbiter.ch

First HD video of Earth from space


ISS - International Space Station patch.

June 19, 2015

Barcelona, ​​Spain

Video above: Captured by Iris, UrtheCast's Ultra HD video camera aboard the International Space Station. Video Credit: UrtheCast Corp.

The company released UrtheCast color images and high definition of our planet captured from the space station ISS.

London, UK

Video above: Captured by Iris, UrtheCast's Ultra HD video camera aboard the International Space Station. Video Credit: UrtheCast Corp.

The UrtheCast private company, specializing in satellite imagery, has posted unprecedented views of the Earth. With two goals placed on the International Space Station (ISS), she recorded videos from London, Barcelona and Boston. Thus, the general public can see for the first time these three cities from space in high definition, color and movement. It is particularly possible to see cars roll or move boats on the Thames.

Boston, U.S.A.

Video above: Captured by Iris, UrtheCast's Ultra HD video camera aboard the International Space Station. Video Credit: UrtheCast Corp.

The UrtheCast cameras are using gyroscopic stabilizers to capture images while following the revolution of the Earth.

International Space Station. Image Credit: NASA

Related links:

UrtheCast Corp: https://www.urthecast.com/

International Space Station (ISS): http://www.nasa.gov/mission_pages/station/main/index.html

Image (mentioned), Videos (mentioned), Text, Credit: Orbiter.ch Aerospace.

Greetings, Orbiter.ch

Veteran NASA Spacecraft Nears 60,000th Lap Around Mars, No Pit Stops


NASA - 2001 Mars Odyssey logo.

June 19, 2015

Mars Odyssey spacecraft. Image Credits: NASA

NASA's Mars Odyssey spacecraft will reach a major milestone June 23, when it completes its 60,000th orbit since arriving at the Red Planet in 2001.

Named after the bestselling novel “2001: A Space Odyssey” by Arthur C. Clarke, Odyssey began orbiting Mars almost 14 years ago, on Oct. 23, 2001. On Dec. 15, 2010, it became the longest-operating spacecraft ever sent to Mars, and continues to hold that record today.

Odyssey, which discovered widespread water ice just beneath the surface of the Red Planet, is still going strong today, serving as a key communications relay for NASA's Mars rovers and making continued contributions to planetary science.

“This orbital milestone is an opportunity to celebrate Odyssey’s many achievements,” said Jim Green, NASA’s director of Planetary Science. “Odyssey will continue to help lay a foundation for the first humans to Mars in the 2030s through NASA’s Journey to Mars initiative.”

Odyssey’s orbital milestone translates into about 888 million miles (1.43 billion kilometers) traversed by the spacecraft. In addition to the 286 million miles (460 million kilometers) covered on its trip from Earth to Mars, the spacecraft is a high-mileage vehicle like no other, but remains in fine condition.


Image above: Gale Crater, home to NASA's Curiosity Mars rover, shows a new face in this image made using data from the THEMIS camera on NASA's Mars Odyssey orbiter. The colors come from an image processing method that identifies mineral differences in surface materials and displays them in false colors. Image Credits: NASA/JPL-Caltech/Arizona State University.

"The spacecraft is in good health, with all subsystems functional and with enough propellant for about 10 more years," said David Lehman, project manager for the Mars Odyssey at NASA’s Jet Propulsion Laboratory (JPL) in Pasadena, California.

Odyssey's major discoveries began in the early months of its two-year primary mission, with gamma-ray and neutron measurements that indicated plentiful water ice just beneath the surface at high latitudes on Mars. The spacecraft's unexpectedly long service has enabled achievements such as completion of the highest-resolution global map of Mars and observation of seasonal and year-to-year changes, such as freezing and thawing of carbon dioxide.

Through its many accomplishments, the spacecraft also has aided NASA’s preparations for human missions to Mars by monitoring radiation in the environment around the planet via the Mars Radiation Environment Experiment, developed at NASA’s Johnson Space Center in Houston.

Odyssey currently is completing an adjustment to an orbit that will position it to pass over Martian terrain lit by early-morning sunlight rather than afternoon light. In its current orbit, the spacecraft always flies near each pole and along what is called the terminator. The terminator is a moving “line” that encircles Mars and passes through any point on the planet’s surface at sunrise and again at sunset, separating the portion of Mars lit by the sun from the portion experiencing darkness, dividing day and night. The position of this line varies by time of day and time of year.


Image above: Seen shortly after local Martian sunrise, clouds gather in the summit pit, or caldera, of Pavonis Mons, a giant volcano on Mars, in this image from the Thermal Emission Imaging System (THEMIS) on NASA's Mars Odyssey orbiter. Image Credits: NASA/JPL-Caltech/Arizona State University.

"Upcoming observations will focus on what is happening in the Martian atmosphere in the morning, such as clouds, hazes and fogs, and on frosts on the surface that burn off by later in the day," said Jeffrey Plaut, Odyssey project scientist at JPL.

The planned drift to a morning-daylight orbit began in 2012, was accelerated in 2014, and will be completed with a maneuver in November to lock in the orbit timing so that each pass over the equator occurs at the same time of day.

"We have performed many orbit maneuvers over the long life of this mission, and we will use that experience conducting the one to halt the drift," said Steve Sanders, Odyssey spacecraft engineer at Lockheed Martin Space Systems in Denver. 

To date, Odyssey's Thermal Emission Imaging System (THEMIS) has yielded 208,240 images in visible-light wavelengths and 188,760 in thermal infrared wavelengths. THEMIS images are the basis for detailed global maps and identification of some surface materials, such as chloride salt deposits and silica-rich terrain. The infrared imaging also indicates how quickly regions of the surface cool at night or warm in sunlight, telling researchers how dusty or rocky the ground is.

Odyssey's three-instrument Gamma Ray Spectrometer (GRS) suite detected significant amount of hydrogen on the planet -- interpreted as water ice hidden beneath the surface. This discovery prompted NASA to send its Phoenix Mars Lander to an arctic plain on Mars in 2008, where it examined the water ice detected by Odyssey. The spectrometer suite also mapped global distribution of key chemical elements, such as iron and potassium. The University of Arizona, Tucson, headed its development. Two GRS instruments are still active: the high-energy neutron detector from the Russian Space Research Institute and the neutron spectrometer from Los Alamos National Laboratories in New Mexico.

As a communications relay for NASA's Mars rovers, Odyssey has transmitted to Earth more than 90 percent of the data received from the Opportunity rover. Future plans for Odyssey include relay duty for NASA and European Space Agency landers arriving on Mars in 2016.

Odyssey launched on April 7, 2001 from Cape Canaveral Air Force Station, Florida. JPL manages the Mars Odyssey Project for NASA's Science Mission Directorate in Washington. Lockheed Martin built the spacecraft and collaborates with JPL in mission operations. Arizona State University, Tempe, provided and operates THEMIS.

Related links:

Odyssey's Thermal Emission Imaging System (THEMIS): http://mars.nasa.gov/odyssey/mission/instruments/themis/

Odyssey's three-instrument Gamma Ray Spectrometer (GRS): http://mars.jpl.nasa.gov/odyssey/mission/instruments/grs/

Phoenix Mars Lander: http://www.nasa.gov/mission_pages/phoenix/main/index.html

For more information about Odyssey, visit: http://mars.jpl.nasa.gov/odyssey

Images (mentioned), Text, Credits: NASA/Dwayne Brown/Laurie Cantillo.

Cheers, Orbiter.ch

Rosetta - MIRO maps water in comet’s coma


ESA - Rosetta Mission patch.

June 19, 2015

In a paper accepted for publication in the journal Astronomy & Astrophysics, the MIRO team present their first map of water vapour in the coma of Comet 67P/Churyumov-Gerasimenko.


MIRO, the Microwave Instrument for the Rosetta Orbiter, first detected the emission from water molecules in the coma of Comet 67P/C-G on 6 June 2014, when Rosetta was 350,000 km from the comet, approximately equivalent to the distance of the Earth from the Moon. At the time, the comet was 3.9 AU – about 580 million km – from the Sun.

Since early July 2014, the MIRO team have been continuously monitoring water in the comet's environment, measuring its properties at different locations across the coma. Being in very close proximity to 67P/C-G, Rosetta, with the MIRO instrument on board, can 'dissect' the distribution of water and other molecules around the comet. Existing ground-based observatories and near-Earth space telescopes can at most get a global view of water in the outermost parts of a comet's coma.

As Rosetta approached the comet and MIRO could resolve the nucleus, the instrument was able to detect water in the coma by measuring the direct emission from water vapour in the coma and by observing absorption of radiation from the nucleus at water specific frequencies as the radiation passed through the coma.

On 7 September 2014, when Rosetta was 58 km from the comet centre, the MIRO team obtained their first map of the nucleus of 67P/C-G and its surroundings. Since MIRO is a single-pixel instrument, the scanning procedure took almost four hours, during which the nucleus had turned by about 90 degrees.


Graphic above: MIRO's spectral map of water at Comet 67P/C-G, obtained on 7 September 2014. Graphic From N. Biver et al. (2015).

The map shows 201 spectra, covering the nucleus as well as parts of the coma around it. Each spectrum corresponds to the average of one to four nearby spectra, that were combined to obtain a higher signal-to-noise ratio.

The strongest signatures of water emission are observed in the off-nucleus spectra on the comet's day side; similarly, the strongest absorption features are seen in the spectra covering the day side of the nucleus. A few spectra sampling both coma and nucleus on the limb exhibit a combination of emission and absorption features.

Weak absorption was observed in the spectra covering the cool nucleus on the comet's night side, while only weak emission was detected over some of the coldest spots on the nucleus, with hardly any signs of water close to the south pole of 67P/C-G. The off-nucleus spectra on the night side also show weak emission lines from water in the coma.


Image above: An indication of the position of each of MIRO's spectra with respect to the comet nucleus. The Sun is to the left. Data from Biver et al. (2015); the nucleus is represented according to the comet shape model 5, image  from Jorda et al. (2015).

This map was obtained using the spectral line of the H216O water molecule at a frequency of 556.936 GHz. An analogous, but coarser map was obtained using a much fainter spectral feature detected at a frequency of 547.676 GHz, characteristic of a different type of water molecule, H218O, which contains a heavy oxygen (18O) atom.

“Our observations show that the distribution of water in the coma is highly inhomogeneous,” explains Nicolas Biver, CNRS researcher at LESIA-Observatoire de Paris in Meudon, France, and lead author of the study.

“We found the highest density of water just above the neck, close to the north pole of the comet's rotation axis: in this narrow region, the column density of water is up to two orders of magnitude higher than elsewhere in the coma,” adds Dr Biver.


Image above: The column density of water around Comet 67P/C-G as measured by the MIRO instrument on Rosetta. Image from N. Biver et al. (2015).

Lower but still substantial amounts of water are detected over the day side of the nucleus up to the terminator between the illuminated and dark side. The lowest amounts of water are found on the comet's night side – particularly over the southern polar regions; these could be due to either local outgassing or circulation effects within the coma, causing water to flow from the day to the night side.

Since last September, scientists in the MIRO team have obtained and are still analysing more maps of the distribution of water in the coma of 67P/C-G, as the comet is moving closer to the Sun.

Dr Sam Gulkis, Principal Investigator of MIRO, reports that the instrument is performing well, and observations of 67P/C-G are continuing daily as the comet approaches perihelion in August 2015.

MIRO:

The MIRO instrument was built at the Jet Propulsion Laboratory, California Institute of Technology with contributions from LESIA and LERMA, Observatoire de Paris and the Max-Planck-Institut für Sonnensystemforschung. Funding was provided by the National Aeronautics and Space Administration, CNES and CNRS/INSU, and DLR and MPG.

Related article:

Ultraviolet study reveals surprises in comet coma: http://orbiterchspacenews.blogspot.ch/2015/06/ultraviolet-study-reveals-surprises-in.html

Related links:

Rosetta Mission: http://www.esa.int/Our_Activities/Space_Science/Rosetta

Rosetta at Astrium: http://www.astrium.eads.net/en/programme/rosetta-1go.html

Rosetta at DLR: http://www.dlr.de/dlr/en/desktopdefault.aspx/tabid-10394/

Ground-based comet observation campaign: http://www.rosetta-campaign.net/home

ESA Rosetta blog: http://blogs.esa.int/rosetta/

Images (mentioned), Text, Credit: European Space Agency (ESA).

Best regards, Orbiter.ch

Hubble's True Blue Compact Dwarf


NASA - Hubble Space Telescope patch.

June 19, 2015


This NASA/ESA Hubble Space Telescope image shows a galaxy known as UGC 11411. It is a galaxy type known as an irregular blue compact dwarf (BCD) galaxy.

BCD galaxies are about a tenth of the size of a typical spiral galaxy such as the Milky Way and are made up of large clusters of hot, massive stars that ionize the surrounding gas with their intense radiation. Because these stars are so hot they glow brightly with a blue hue, giving galaxies like UGC 11411 their characteristic blue tint. With these massive stars being less than 10 million years old, they are very young compared to stellar standards. They were created during a starburst, a galaxy-wide episode of furious star formation. UGC 11411 in particular has an extremely high star formation rate, even for a BCD galaxy.

Unusually for galaxies with such intense star-forming regions, BCDs don’t contain either a lot of dust, or the heavy elements that are typically found as trace elements in recently formed stars, making their composition very similar to that of the material from which the first stars formed in the early universe. Because of this astronomers consider BCD galaxies to be good objects to study to improve our understanding of primordial star-forming processes.

The bright stars in the image are foreground stars in our own Milky Way galaxy.

Hubble orbiting Earth

The Hubble Space Telescope is a project of international cooperation between NASA and the European Space Agency. NASA's Goddard Space Flight Center in Greenbelt, Maryland, manages the telescope. The Space Telescope Science Institute (STScI) in Baltimore conducts Hubble science operations. STScI is operated for NASA by the Association of Universities for Research in Astronomy, Inc., in Washington, D.C.

For more images and information about the Hubble Space Telescope, visit: http://hubblesite.org/ and http://www.nasa.gov/hubble and http://www.spacetelescope.org/

Image, Video, Credits: ESA/Hubble & NASA/Text Credits: European Space Agency (ESA)/Ashley Morrow.

Greetings, Orbiter.ch

Night-Shining Clouds


NASA - Aeronomy of Ice in the Mesosphere (AIM) logo.


June 19, 2015


In the late spring and summer, unusual clouds form high in the atmosphere above the polar regions of the world. As the lower atmosphere warms, the upper atmosphere gets coooler, and ice crystals form on meteor dust and other particles high in the sky. The result is noctilucent or “night-shining” clouds (NLCs)—electric blue wisps that grow on the edge of space.

NASA’s Aeronomy of Ice in the Mesosphere (AIM) spacecraft observed noctilucent clouds on June 10, 2015. This image is a composite of several satellite passes over the Arctic, and the clouds appear in various shades of light blue to white, depending on the density of the ice particles. The instrument measures albedo—how much light is reflected back to space by the high-altitude clouds.

Noctilucent clouds were first described in the mid-19th century after the eruption of the Krakatau volcano. Volcanic ash spread through the atmosphere, making for vivid sunsets around the world and provoking the first known observations of NLCs. At first people thought they were a side-effect of the volcano, but long after Krakatau’s ash settled, the wispy, glowing clouds remained.

Aeronomy of Ice in the Mesosphere (AIM) spacecraft

In the past decade, AIM has been observing and measuring these seasonal, high-altitude cloud formations. Researchers have found that they are appearing earlier and stretching to lower latitudes with greater frequency. There is some evidence that this is a result of increased greenhouse gases in the atmosphere.

Though they were not thick enough to appear in AIM imagery, some noctilucent clouds were visible to ground-based observers in the continental United States on June 9 and 10.

More:

NASA's Earth Observatory: http://earthobservatory.nasa.gov/IOTD/view.php?id=86036

For more information about Aeronomy of Ice in the Mesosphere (AIM), visit: http://www.nasa.gov/mission_pages/aim/index.html

Images, Text, Credits: NASA Earth Observatory map by Joshua Stevens, using Polar Mesospheric Cloud data from the University of Colorado Laboratory for Atmospheric and Space Physics/Caption: Mike Carlowicz/Sarah Loff.

Greetings, Orbiter.ch

Cassini Sends Back Views After Zooming Past Dione


NASA - Cassini Mission to Saturn patch.


June 19, 2015

Dione's Craggy Surface

Image above: NASA's Cassini imaging scientists processed this view of Saturn's moon Dione, taken during a close flyby on June 16, 2015. Image Credit: NASA/JPL-Caltech/Space Science Institute.

The rugged landscape of Saturn's fracture-faced moon Dione is revealed in images sent back by NASA's Cassini spacecraft from its latest flyby. Cassini buzzed past Dione on June 16, coming within 321 miles (516 kilometers) of the moon's surface.

Raw, unprocessed images from the flyby are available via the Cassini mission website at: http://saturn.jpl.nasa.gov/photos/raw

A selection of some of the images is also available from the Cassini imaging team's website at: http://www.ciclops.org/view_event/212/DIONE-REV-217-RAW-PREVIEW

On Aug. 17, the spacecraft will make its final flyby of Dione, diving to within 295 miles (474 kilometers) of the surface. The final Dione encounter will be Cassini's second-closest brush with the icy moon. A December 2011 flyby saw the spacecraft reach an altitude of just 60 miles (100 kilometers) above Dione.

In the Company of Dione

Image above: NASA's Cassini imaging scientists processed this view of Saturn's moon Dione, taken during a close flyby on June 16, 2015. Image Credit: NASA/JPL-Caltech/Space Science Institute.

The Cassini-Huygens mission is a cooperative project of NASA, ESA (European Space Agency) and the Italian Space Agency. NASA's Jet Propulsion Laboratory in Pasadena, California, manages the mission for the agency's Science Mission Directorate in Washington. JPL is a division of the California Institute of Technology in Pasadena. The Cassini imaging operations center is based at the Space Science Institute in Boulder, Colorado.

For more information about Cassini, visit: http://www.nasa.gov/cassini and http://saturn.jpl.nasa.gov and http://www.esa.int/Our_Activities/Space_Science/Cassini-Huygens

Images (mentioned), Text, Credits: NASA/JPL/Elizabeth Landau / Preston Dyches.

Greetings, Orbiter.ch

jeudi 18 juin 2015

Hubble Sees the 'Teenage Years' of Quasars


NASA - Hubble Space Telescope patch.

June 18, 2015

Astronomers have used the Hubble Space Telescope’s infrared vision to uncover the mysterious early formative years of quasars, the brightest objects in the universe. Hubble’s sharp images unveil chaotic collisions of galaxies that fuel quasars by feeding supermassive central black holes with gas.

“The Hubble observations are definitely telling us that the peak of quasar activity in the early universe is driven by galaxies colliding and then merging together,” said Eilat Glikman of Middlebury College in Vermont. “We are seeing the quasars in their teenage years, when they are growing quickly and all messed up.”


Images above: What was happening in the universe 12 billion years ago? The universe was smaller and so crowded that galaxies collided with each other much more frequently than today. Hubble astronomers looked at dusty quasars where their glow was suppressed by dust, allowing a view of the quasar's surroundings. Images Credits: NASA/ESA.

Discovered in the 1960s, a quasar, contraction of “quasi-stellar object,” pours out the light of as much as one trillion stars from a region of space smaller than our solar system. It took more than two decades of research to come to the conclusion that the source of the light is a gusher of energy coming from supermassive black holes inside the cores of very distant galaxies.

The lingering question has been what turns these brilliant beacons on, and now Hubble has provided the best solution. “The new images capture the transitional phase in the merger-driven black hole scenario,” Glikman said. “The Hubble images are incredibly beautiful.”

“We’ve been trying to understand why galaxies start feeding their central black holes, and galaxy collisions are one leading hypothesis. These observations show that the brightest quasars in the universe really do live in merging galaxies,” said co-investigator Kevin Schawinski of the Swiss Federal Institute of Technology Zurich.

The overwhelming glow of the quasar drowns out the light of the accompanying galaxy, making the signs of mergers difficult to see. Glikman came up with a clever way to use Hubble’s sensitivity at near-infrared wavelengths of light to see the host galaxies by aiming at quasars that are heavily shrouded in dust. The dust dims the quasar’s visible light so that the underlying galaxy can be seen.

The gravitational forces of the merger rob much of the angular momentum that keeps gas suspended in the disks of the colliding galaxies. As galaxies merge, gravitational forces cause the gas in the disks of the colliding galaxies to fall directly toward the supermassive black hole. The accretion zone around the black hole is so engorged with fuel it converts it into a gusher of radiation that blazes across the universe.

Hubble and the sunrise over Earth

Glikman looked for candidate “dust-reddened quasars” in several ground-based infrared and radio sky surveys. Active galaxies in this early phase of evolution are predicted to glow brightly across the entire electromagnetic spectrum, making them detectable in radio and near-infrared wavelengths that are not as easily obscured as other radiation.

She then used Hubble’s Wide Field Camera 3 to take a detailed look at the best candidate targets. Glikman looked at the dust-reddened light of 11 ultra-bright quasars that exist at the peak of the universe’s star-formation era, which was 12 billion years ago. The infrared capability of Hubble’s Wide Field Camera 3 was able to probe deep into the birth of this quasar era.

The paper will be published in the June 18 issue of the Astrophysical Journal.

The Hubble Space Telescope is a project of international cooperation between NASA and the European Space Agency. NASA's Goddard Space Flight Center in Greenbelt, Maryland, manages the telescope. The Space Telescope Science Institute (STScI) in Baltimore conducts Hubble science operations. STScI is operated for NASA by the Association of Universities for Research in Astronomy, Inc., in Washington, D.C.

For more images and information about the Hubble Space Telescope, visit: http://hubblesite.org/news/2015/20 and http://www.nasa.gov/hubble and http://www.spacetelescope.org/

Images (mentioned), Video, Text, Credits: NASA/Felicia Chou/Space Telescope Science Institute/Ray Villard/Lynn Jenner/ESA.

Greetings, Orbiter.ch

ROSCOSMOS: Planned ISS orbit correction


ROSCOSMOS - Russian Vehicles patch.

06/18/2015

In accordance with the program of ballistic support the International Space Station (ISS), June 18, 2015 we make the planified correction of the orbit of the space station for orbit flight for the arrival of Soyuz TMA-17M (will be launched on July 24).

International Space Station (ISS)

Engines of Progress M-26M ignition at 13:59 and worked 248 seconds (Moscow time). As a result of the maneuver the average height of the flight station increased by 0.8 km.

ROSCOSMOS Press Release: http://www.federalspace.ru/21542/

Image, Text, Credits: Press Service of the Russian Federal Space Agency/ROSCOSMOS/NASA/Orbiter.ch Aerospace.

Greetings, Orbiter.ch

Hubble views a bizarre cosmic quartet


ESA - Hubble Space Telescope logo.

18 June 2015

Hubble views bizarre cosmic quartet HCG 16

This new NASA/ESA Hubble Space Telescope image shows a gathering of four cosmic companions. This quartet forms part of a group of galaxies known as the Hickson Compact Group 16, or HCG 16 — a galaxy group bursting with dramatic star formation, tidal tails, galactic mergers and black holes.

This quartet is composed of (from left to right) NGC 839, NGC 838, NGC 835, and NGC 833 — four of the seven galaxies that make up the entire group. They shine brightly with their glowing golden centres and wispy tails of gas [1], set against a background dotted with much more distant galaxies.

Wide-field view of galaxy group HCG 16 (ground-based view)

Compact groups represent some of the densest concentrations of galaxies known in the Universe, making them perfect laboratories for studying weird and wonderful phenomena. Hickson Compact Groups in particular, as classified by astronomer Paul Hickson in the 1980s, are surprisingly numerous, and are thought to contain an unusually high number of galaxies with strange properties and behaviours [2].

HCG 16 is certainly no exception. The galaxies within it are bursting with dramatic knots of star formation and intensely bright central regions. Within this single group, astronomers have found two LINERs, one Seyfert 2 galaxy and three starburst galaxies.

Zooming into galaxy group HCG 16

These three types of galaxy are all quite different, and can each help us to explore something different about the cosmos. Starbursts are dynamic galaxies that produce new stars at much greater rates than their peers. LINERs (Low-Ionisation Nuclear Emission-line Regions) contain heated gas at their cores, which spew out radiation. In this image NGC 839 is a LINER-type and luminous infrared galaxy and its companion NGC 838 is a LINER-type galaxy with lots of starburst activity and no central black hole.

The remaining galaxies, NGC 835 and NGC 833, are both Seyfert 2 galaxies which have incredibly luminous cores when observed at other wavelengths than in the visible light, and are home to active supermassive black holes.

The X-ray emission emanating from the black hole within NGC 833 (far right) is so high that it suggests the galaxy has been stripped of gas and dust by past interactions with other galaxies. It is not alone in having a violent history — the morphology of NGC 839 (far left) is likely due to a galactic merger in the recent past, and long tails of glowing gas can be seen stretching away from the galaxies on the right of the image.

Panning across galaxy group HCG 16

This new image uses observations from Hubble's Wide Field Planetary Camera 2, combined with data from the ESO Multi-Mode Instrument installed on the European Southern Observatory’s New Technology Telescope in Chile. A version of this image was entered into the Hubble's Hidden Treasures image processing competition by contestants Jean-Christophe Lambry and Marc Canale.

Notes:

[1] A tidal tail is a thin, elongated region of stars and interstellar gas that extends into space from a galaxy. They are a result of the strong gravitational forces around interacting galaxies.

[2] Hubble has imaged several of these groups before, including HCG 31 (opo1008a), HCG 92 (heic0910i), HCG 59 (potw1004a), HCG 22 (potw1349a), HCG 7 (potw1132a), HCG 87 (opo9931a), and HCG 90 (heic0902a).

Notes for editors:

The Hubble Space Telescope is a project of international cooperation between ESA and NASA.

Links:

Marc Canale’s image on Flickr: https://www.flickr.com/photos/76658917@N04/7065663749/in/pool-1898430@N24/

Jean-Christophe Lambry’s image on Flickr: https://www.flickr.com/photos/54835884@N05/7406623876/in/photostream/

Images of Hubble: http://www.spacetelescope.org/images/archive/category/spacecraft/

Images, Text, Credits: NASA, ESA, ESO, J. Charlton (The Pennsylvania State University)
Acknowledgements: Jean-Christophe Lambry, Marc Canale/Digitized Sky Survey 2
Acknowledgement: Davide De Martin/Videos: NASA, ESA, Digitized Sky Survey 2. ESO.

Greetings, Orbiter.ch

Hot lava flows discovered on Venus


ESA - Venus Express Mission patch.

18 June 2015

ESA’s Venus Express has found the best evidence yet for active volcanism on Earth’s neighbour planet.

Seeing the planet’s surface is extremely difficult due to its thick atmosphere, but radar observations by previous missions to Venus have revealed it as a world covered in volcanoes and ancient lava flows.

Evidence for active volcanoes on Venus (click on the image for enlarge)

Venus is almost exactly the same size as Earth and has a similar bulk composition, so is likely to have an internal heat source, perhaps due to radioactive heating. This heat has to escape somehow, and one possibility is that it does so in the form of volcanic eruptions.

Some models of planetary evolution suggest that Venus was resurfaced in a cataclysmic flood of lava around half a billion years ago. But whether Venus is active today has remained a hot topic in planetary science.

ESA’s Venus Express, which completed its eight-year study of the planet last year, conducted a range of observations at different wavelengths to address this important question.

In a study published in 2010, scientists reported that the infrared radiation coming from three volcanic regions was different to that from the surrounding terrain. They interpreted this as coming from relatively fresh lava flows that had not yet experienced significant surface weathering. These flows were found to be less than 2.5 million years old, but the study could not establish whether there is still active volcanism on the planet.

Volcanic activity on Venus?

An additional piece of evidence was reported in 2012, showing a sharp rise in the sulphur dioxide content of the upper atmosphere in 2006–2007, followed by a gradual fall over the following five years. Although changes in wind patterns could have caused this, the more intriguing possibility is that episodes of volcanic activity were injecting vast amounts of sulphur dioxide into the upper atmosphere.

Now, using a near-infrared channel of the spacecraft’s Venus Monitoring Camera (VMC) to map thermal emission from the surface through a transparent spectral window in the planet’s atmosphere, an international team of planetary scientists has spotted localised changes in surface brightness between images taken only a few days apart.

“We have now seen several events where a spot on the surface suddenly gets much hotter, and then cools down again,” says Eugene Shalygin from the Max Planck Institute for Solar System Research (MPS) in Germany, and lead author of the paper reporting the results in Geophysical Research Letters this month.

“These four ‘hotspots’ are located in what are known from radar imagery to be tectonic rift zones, but this is the first time we have detected that they are hot and changing in temperature from day to day. It is the most tantalising evidence yet for active volcanism.”

 Brightness changes in Ganiki Chasma

The hotspots are found along the Ganiki Chasma rift zone close to the volcanoes Ozza Mons and Maat Mons. Rift zones are results of fracturing of the surface, which is often associated with upwelling of magma below the crust. This process can bring hot material to the surface, where it may be released through fractures as a lava flow.

“These observations are close to the limits of the spacecraft’s capabilities and it was extremely difficult to make these detections with Venus’ thick clouds impairing the view,” says co-author Wojciech Markiewicz. “But the VMC was designed to make these systematic observations of the surface and luckily we clearly see these regions that change in temperature over time, and that are notably higher than the average surface temperature.”

Because VMC’s view is blurred by the clouds, the areas of increased emission appear spread out over large areas more than 100 km across, but the hot regions on the surface below are probably much smaller. Indeed, for the hotspot known as ‘Object A’, the team calculate that the feature may only be around 1 square kilometre in size, with a temperature of 830°C, much higher than the global average of 480°C.

The Ganiki Chasma rift zone was already considered to be one of the most recently geologically active regions on the planet, and as the new analysis suggests, it is still active today.

Venus Express made first topography data of volcanoes on Venus

“It looks like we can finally include Venus in the small club of volcanically active Solar System bodies,” says Håkan Svedhem, ESA’s Venus Express project scientist.

“Our study shows that Venus, our nearest neighbour, is still active and changing in the present day – it is an important step in our quest to understand the different evolutionary histories of Earth and Venus.”

Notes for editors:

“Active volcanism on Venus in the Ganiki Chasma rift zone,” by E.V. Shalygin et al is accepted for publication in Geophysical Research Letters:
http://onlinelibrary.wiley.com/doi/10.1002/2015GL064088/full

Related links:

Looking at Venus: http://www.esa.int/Our_Activities/Space_Science/Venus_Express

Venus Express Press Kit: http://www.esa.int/esaSC/SEM08K2VQUD_1_spk.html

Venus Express brochure (pdf): http://esamultimedia.esa.int/docs/VENUSEXPRESSLR.pdf

Venus Express in-depth: http://sci.esa.int/venusexpress

ESA’s planetary science archive: http://archives.esac.esa.int/psa

Images, Text, Credits: ESA/AOES Medialab/E. Shalygin et al (2015).

Cheers, Orbiter.ch

mercredi 17 juin 2015

Study: Third of Big Groundwater Basins in Distress


NASA - GRACE Mission logo.

June 17, 2015

About one third of Earth's largest groundwater basins are being rapidly depleted by human consumption, despite having little accurate data about how much water remains in them, according to two new studies led by the University of California, Irvine (UCI), using data from NASA's Gravity Recovery and Climate Experiment (GRACE) satellites.

This means that significant segments of Earth’s population are consuming groundwater quickly without knowing when it might run out, the researchers conclude. The findings are published yesterday in Water Resources Research.

(Click on the image for enlarge)

Image above: Groundwater storage trends for Earth's 37 largest aquifers from UCI-led study using NASA GRACE data (2003 – 2013). Of these, 21 have exceeded sustainability tipping points and are being depleted, with 13 considered significantly distressed, threatening regional water security and resilience. Image Credits: UC Irvine/NASA/JPL-Caltech.

"Available physical and chemical measurements are simply insufficient," said UCI professor and principal investigator Jay Famiglietti, who is also the senior water scientist at NASA's Jet Propulsion Laboratory in Pasadena, California. "Given how quickly we are consuming the world’s groundwater reserves, we need a coordinated global effort to determine how much is left."

The studies are the first to comprehensively characterize global groundwater losses with data from space, using readings generated by NASA’s twin GRACE satellites. GRACE measures dips and bumps in Earth’s gravity, which are affected by the mass of water. In the first paper, researchers found that 13 of the planet's 37 largest aquifers studied between 2003 and 2013 were being depleted while receiving little to no recharge.

Eight were classified as "overstressed," with nearly no natural replenishment to offset usage. Another five were found to be "extremely" or "highly" stressed, depending upon the level of replenishment in each. Those aquifers were still being depleted but had some water flowing back into them.

The most overburdened aquifers are in the world’s driest areas, where populations draw heavily on underground water. Climate change and population growth are expected to intensify the problem.

"What happens when a highly stressed aquifer is located in a region with socioeconomic or political tensions that can’t supplement declining water supplies fast enough?" asked Alexandra Richey, the lead author on both studies, who conducted the research as a UCI doctoral student. "We’re trying to raise red flags now to pinpoint where active management today could protect future lives and livelihoods."

The research team -- which included co-authors from NASA, the National Center for Atmospheric Research, National Taiwan University and UC Santa Barbara -- found that the Arabian Aquifer System, an important water source for more than 60 million people, is the most overstressed in the world.

The Indus Basin aquifer of northwestern India and Pakistan is the second-most overstressed, and the Murzuk-Djado Basin in northern Africa is third. California’s Central Valley, used heavily for agriculture and suffering rapid depletion, was slightly better off, but was still labeled highly stressed in the first study.

"As we’re seeing in California right now, we rely much more heavily on groundwater during drought," said Famiglietti. "When examining the sustainability of a region’s water resources, we absolutely must account for that dependence."


Image above: Gravity Recovery and Climate Experiment (GRACE) satellites. Image Credit: Astrium.

In a companion paper published today in the same journal, the scientists conclude that the total remaining volume of the world’s usable groundwater is poorly known, with estimates that often vary widely. The total groundwater volume is likely far less than rudimentary estimates made decades ago. By comparing their satellite-derived groundwater loss rates to what little data exist on groundwater availability, the researchers found major discrepancies in projected "time to depletion." In the overstressed Northwest Sahara Aquifer System, for example, time to depletion estimates varied between 10 years and 21,000 years.

"We don’t actually know how much is stored in each of these aquifers. Estimates of remaining storage might vary from decades to millennia," said Richey. "In a water-scarce society, we can no longer tolerate this level of uncertainty, especially since groundwater is disappearing so rapidly."

The study notes that the dearth of groundwater is already leading to significant ecological damage, including depleted rivers, declining water quality and subsiding land.

Groundwater aquifers are typically located in soils or deeper rock layers beneath Earth’s surface. The depth and thickness of many large aquifers make it tough and costly to drill or otherwise reach bedrock and understand where the moisture bottoms out. But it has to be done, the authors say.

To read the technical papers, visit: http://onlinelibrary.wiley.com/doi/10.1002/2015WR017349/abstract and http://onlinelibrary.wiley.com/doi/10.1002/2015WR017351/abstract

GRACE is a joint mission with the German Aerospace Center and the German Research Center for Geosciences, in partnership with the University of Texas at Austin. JPL developed the GRACE spacecraft and manages the mission for NASA's Science Mission Directorate, Washington.

For more information on GRACE, visit: http://www.nasa.gov/grace and http://www.csr.utexas.edu/grace

NASA uses the vantage point of space to increase our understanding of our home planet, improve lives and safeguard our future. NASA develops new ways to observe and study Earth's interconnected natural systems with long-term data records. The agency freely shares this unique knowledge and works with institutions around the world to gain new insights into how our planet is changing.

For more information about NASA's Earth science activities, visit: http://www.nasa.gov/earth

Images (mentioned), Text, Credits: NASA/JPL/Alan Buis/UC Irvine/Janet Wilson/Tony Greicius.

Greetings, Orbiter.ch

International Spacecraft Carrying NASA’s Aquarius Instrument Ends Operations


NASA - Aquarius Mission logo.

June 17, 2015

An international Earth-observing mission launched in 2011 to study the salinity of the ocean surface ended June 8 when an essential part of the power and attitude control system for the SAC-D spacecraft, which carries NASA's Aquarius instrument, stopped operating. The Aquarius instrument successfully achieved its science objectives and completed its primary three-year mission in November 2014.


Image above: Artist’s rendering of the Aquarius/SAC-D satellite as it would appear in orbit. The Aquarius mission studied the interactions between changes in the ocean circulation, global water cycle and climate by measuring ocean surface salinity. Image Credits: NASA.

The Aquarius/Satélite de Aplicaciones Científicas (SAC)-D satellite observatory, was an international collaboration between NASA and Argentina’s space agency, Comisión Nacional de Actividades Espaciales (CONAE), with participation from Brazil, Canada, France and Italy. NASA launched Aquarius/SAC-D from Vandenberg Air Force Base, California, on June 10, 2011.

Aquarius was a pathfinder mission to demonstrate that accurate, scientifically-significant measurements of salinity could be made from space. It was also the first mission to combine use of passive (radiometer) and active (radar) measurements at L-band.

Aquarius: One Year Observing the Salty Seas

Video above: This video provides a global tour of sea surface salinity using measurements taken by NASA's Aquarius instrument aboard the Aquarius/SAC-D spacecraft, from December 2011 through December 2012. Red represents areas of high salinity, while blue represents areas of low salinity. Aquarius is a focused effort to measure sea surface salinity and will provide the global view of salinity variability needed for climate studies. The mission is a collaboration between NASA and the Space Agency of Argentina (Comisión Nacional de Actividades Espaciales). Video Credits: NASA/Goddard.

The instrument’s surface salinity measurements are contributing to a better understanding of ocean dynamics and advancing climate and ocean models, both from season to season and year to year. These models still are improving El Niño prediction. Aquarius global salinity maps are revealing how freshwater plumes coming from the mouth of large rivers and the precipitation and evaporation over the oceans affect the salinity structure of the ocean.

“The Aquarius sensor collected three years and nine months of valuable data,” said Aquarius principal investigator Gary Lagerloef of Earth & Space Research, Seattle. “It was truly a pioneering effort to determine how accurately we could measure ocean salinity from space and for the first time study large and small-scale interactions of the global water cycle.”

Preliminary indications are that an onboard hardware component called a Remote Terminal Unit (RTU) shut down, which caused the loss of onboard power regulation and spacecraft attitude stabilization.


Image above: Simple diagram of the Aquarius/SAC-D satellite Image Credits: NASA.

Salinity information is critical to improving our understanding of two major components of Earth’s climate system: the water cycle and ocean circulation. By measuring ocean salinity from space, Aquarius provided new insights into the massive natural exchange of freshwater between the ocean, atmosphere and sea ice, which – in turn – influences ocean circulation, weather and climate.

Data from Aquarius revealed how extreme floods impact our seas and how low-salinity river plumes affect hurricane intensity. Aquarius data also were integral to the Salinity Processes in the Upper Ocean Regional Study (SPURS), a year-long international field study of the oceanographic processes that sustain the maximum surface salinities in the central subtropical North Atlantic, and influence global ocean circulation.

The Aquarius instrument was jointly built by NASA’s Jet Propulsion Laboratory (JPL) in Pasadena, California, and NASA’s Goddard Space Flight Center in Greenbelt, Maryland. JPL managed Aquarius through the mission’s commissioning phase and archives mission data. Goddard managed the mission’s operations phase and processes Aquarius science data. CONAE provided the SAC-D spacecraft, an optical camera, a thermal camera in collaboration with Canada, a microwave radiometer, sensors developed by various Argentine institutions, and the mission operations center in Argentina. France and Italy also contributed instruments.

NASA uses the vantage point of space to increase our understanding of our home planet, improve lives, and safeguard our future. NASA develops new ways to observe and study Earth's interconnected natural systems with long-term data records. The agency freely shares this unique knowledge and works with institutions around the world to gain new insights into how our planet is changing.

For more on the Aquarius/SAC-D mission, visit: http://www.nasa.gov/aquarius

For more information about NASA’s Earth science activities, visit: http://www.nasa.gov/earth

Images (mentioned), Video (mentioned), Text, Credits: NASA/Dwayne Brown/JPL/Alan Buis/Goddard Space Flight Center/Rani Gran/Karen Northon.

Greetings, Orbiter.ch