vendredi 15 décembre 2017

Weekly Recap From the Expedition Lead Scientist, week of November 27, 2017


ISS - Expedition 53 Mission patch.

Dec. 15, 2017

(Highlights: Week of November 27, 2017) - Last week aboard the International Space Station, crew members supported research in the fields of human health, plant science, physics and technology development.


Image above: NASA astronaut Randy Bresnik performs a blood draw as part of the MARROW investigation. Image Credit: NASA.

NASA astronaut Randy Bresnik removed the Long Duration Sorbent Testbed (LDST) locker from EXPRESS Rack 5 for its return on SpaceX-13. Exposure to space cabin environments can affect the performance of products designed to filter and clean air and water. LDST studies substances that collect other molecules, determining which types would be most effective on long-term missions to Mars or other destinations.

NASA astronaut Mark Vande Hei set up a new temperature monitor for the JAXA Protein Crystal Growth (JAXA PCG) investigation. This was necessary because the previous component stopped reporting data. JAXA Protein Crystal Growth produces high-quality protein crystals of biological macromolecules in microgravity. Detailed analysis of high quality protein crystal structures is useful in designing new pharmaceuticals and catalysts for a wide range of industries.


Image above: ESA astronaut Paolo Nespoli uses the Minus Eight Laboratory Freezer for ISS to store biological samples. Image Credit: NASA.

Bresnik and ESA (European Space Agency) astronaut Paolo Nespoli performed blood collections for the MARROW investigation. The samples were placed in the Minus Eighty Degree Celsius Laboratory Freezer for ISS (MELFI). Marrow looks at the effect of microgravity on bone marrow. It is believed that microgravity, like long-duration bedrest on Earth, has a negative effect on the bone marrow and the blood cells that are produced in the bone marrow.

NASA astronaut Joe Acaba prepared for the 5-day Advanced Plant Habitat Facility (Plant Habitat) checkout by installing power caps on the science carrier microcontroller, filling the water reservoir, and preparing the water refill bag and growth chamber. The crew also performed ten Plant Habitat acoustic measurement sets. The data from the measurements will be used to assess the environmental factors when the Plant Habitat facility is used in the JEM. Plant Habitat is a fully automated facility that will be used to conduct plant bioscience research on the orbiting laboratory. Plant Habitat compares differences in genetics, metabolism, photosynthesis, and gravity sensing between plants grown in space and on Earth in order to understand how microgravity changes plants.


Image above: Alexander Misurkin of Roscosmos and NASA astronaut Joe Acaba perform the SPHERES Zero Robotics investigation, which establishes an opportunity for high school students to design research for the International Space Station. Image Credit: NASA.

Acaba replaced the Additive Manufacturing Facility (Manufacturing Device) feedstock canister, extruder head, and print tray. The AMF uses an extrusion-based "3D printing" method, which enables the production of components on the station for both NASA and commercial objectives.

Other work was done on the following investigations: Payload Card Multilab-X, Rodent Research 6 (RR-6), CEO, Earth Imagery from ISS, Meteor, ISS Ham, Dream XM, One Strange Rock Virtual Reality, SPHERES Zero Robotics, Biochemical Profile, Circadian Rhythms, IPVI, Multi-Omics, NeuroMapping, Probiotics, Sarcolab-3, Space Headaches, ACME-CLD Flame, Two-Phase Flow, ZBOT, JEM Internal Ball Camera, NRCSD #13, Personal CO2 Monitor, PS-TEPC, Radi-N2.

International Space Station (ISS). Animation Credit: NASA

Related links:

Long Duration Sorbent Testbed (LDST): https://www.nasa.gov/mission_pages/station/research/experiments/explorer/Investigation.html?#id=1881

JAXA Protein Crystal Growth (JAXA PCG): https://www.nasa.gov/mission_pages/station/research/experiments/explorer/Investigation.html?#id=151

MARROW: https://www.nasa.gov/mission_pages/station/research/experiments/explorer/Investigation.html?#id=1673

Minus Eighty Degree Celsius Laboratory Freezer for ISS (MELFI): https://www.nasa.gov/mission_pages/station/research/experiments/explorer/Facility.html?#id=56

Advanced Plant Habitat Facility (Plant Habitat): https://www.nasa.gov/mission_pages/station/research/experiments/explorer/Facility.html?#id=2036

Additive Manufacturing Facility (Manufacturing Device): https://www.nasa.gov/mission_pages/station/research/experiments/explorer/Facility.html?#id=1934

Rodent Research 6 (RR-6): https://www.nasa.gov/mission_pages/station/research/experiments/explorer/Investigation.html?#id=7423

CEO: https://www.nasa.gov/mission_pages/station/research/experiments/explorer/Investigation.html?#id=84

Earth Imagery from ISS: https://www.nasa.gov/mission_pages/station/research/experiments/explorer/Investigation.html?#id=7565

Meteor: https://www.nasa.gov/mission_pages/station/research/experiments/explorer/Investigation.html?#id=1174

ISS Ham: https://www.nasa.gov/mission_pages/station/research/experiments/explorer/Investigation.html?#id=337

Dream XM: https://www.nasa.gov/mission_pages/station/research/experiments/explorer/Investigation.html?#id=7626

One Strange Rock Virtual Reality: https://www.nasa.gov/mission_pages/station/research/experiments/explorer/Investigation.html?#id=7598

SPHERES Zero Robotics: https://www.nasa.gov/mission_pages/station/research/experiments/explorer/Investigation.html?#id=679

Biochemical Profile: https://www.nasa.gov/mission_pages/station/research/experiments/explorer/Investigation.html?#id=980

Circadian Rhythms: https://www.nasa.gov/mission_pages/station/research/experiments/explorer/Investigation.html?#id=869

IPVI: https://www.nasa.gov/mission_pages/station/research/experiments/explorer/Investigation.html?#id=1690

Multi-Omics: https://www.nasa.gov/mission_pages/station/research/experiments/explorer/Investigation.html?#id=1689

NeuroMapping: https://www.nasa.gov/mission_pages/station/research/experiments/explorer/Investigation.html?#id=979

Probiotics: https://www.nasa.gov/mission_pages/station/research/experiments/explorer/Investigation.html?#id=2047

Sarcolab-3: https://www.nasa.gov/mission_pages/station/research/experiments/explorer/Investigation.html?#id=725

Space Headaches: https://www.nasa.gov/mission_pages/station/research/experiments/explorer/Investigation.html?#id=174

ACME-CLD Flame: https://www.nasa.gov/mission_pages/station/research/experiments/explorer/Investigation.html?#id=7564

Two-Phase Flow: https://www.nasa.gov/mission_pages/station/research/experiments/explorer/Investigation.html?#id=1034

ZBOT: https://www.nasa.gov/mission_pages/station/research/experiments/explorer/Investigation.html?#id=1135

JEM Internal Ball Camera: https://www.nasa.gov/mission_pages/station/research/experiments/explorer/Investigation.html?#id=7516

Personal CO2 Monitor: https://www.nasa.gov/mission_pages/station/research/experiments/explorer/Investigation.html?#id=1839

PS-TEPC: https://www.nasa.gov/mission_pages/station/research/experiments/explorer/Investigation.html?#id=1031

Radi-N2: https://www.nasa.gov/mission_pages/station/research/experiments/explorer/Investigation.html?#id=874

Space Station Research and Technology: https://www.nasa.gov/mission_pages/station/research/index.html

International Space Station (ISS): https://www.nasa.gov/mission_pages/station/main/index.html

Images (mentioned), Animation (mentioned), Text, Credits: NASA/Michael Johnson/John Love, Lead Increment Scientist Expeditions 53 & 54.

Best regards, Orbiter.ch

Breaking data records bit by bit


CERN - European Organization for Nuclear Research logo.

Dec. 15, 2017


Image above: Magnetic tapes, retrieved by robotic arms, are used for long-term storage (Image: Julian Ordan/CERN).

This year CERN’s data centre broke its own record, when it collected more data than ever before.

During October 2017, the data centre stored the colossal amount of 12.3 petabytes of data. To put this in context, one petabyte is equivalent to the storage capacity of around 15,000 64GB smartphones. Most of this data come from the Large Hadron Collider’s experiments, so this record is a direct result of the outstanding LHC performance, the rest is made up of data from other experiments and backups.

“For the last ten years, the data volume stored on tape at CERN has been growing at an almost exponential rate. By the end of June we had already passed a data storage milestone, with a total of 200 petabytes of data permanently archived on tape,” explains German Cancio, who leads the tape, archive & backups storage section in CERN’s IT department.

The CERN data centre is at the heart of the Organization’s infrastructure. Here data from every experiment at CERN is collected, the first stage in reconstructing that data is performed, and copies of all the experiments’ data are archived to long-term tape storage.

Most of the data collected at CERN will be stored forever, the physics data is so valuable that it will never be deleted and needs to be preserved for future generations of physicists.

“An important characteristic of the CERN data archive is its longevity,” Cancio adds. “Even after an experiment ends all recorded data has to remain available for at least 20 years, but usually longer. Some of the archive files produced by previous CERN experiments have been migrated across different hardware, software and media generations for over 30 years. For archives like CERN’s, that do not only preserve existing data but also continue to grow, our data preservation is particularly challenging.”

While tapes may sound like an outdated mode of storage, they are actually the most reliable and cost-effective technology for large-scale archiving of data, and have always been used in this field. One copy of data on a tape is considered much more reliable than the same copy on a disk.

CERN currently manages the largest scientific data archive in the High Energy Physics (HEP) domain and keeps innovating in data storage,” concludes Cancio.

Note:

CERN, the European Organization for Nuclear Research, is one of the world’s largest and most respected centres for scientific research. Its business is fundamental physics, finding out what the Universe is made of and how it works. At CERN, the world’s largest and most complex scientific instruments are used to study the basic constituents of matter — the fundamental particles. By studying what happens when these particles collide, physicists learn about the laws of Nature.

The instruments used at CERN are particle accelerators and detectors. Accelerators boost beams of particles to high energies before they are made to collide with each other or with stationary targets. Detectors observe and record the results of these collisions.

Founded in 1954, the CERN Laboratory sits astride the Franco–Swiss border near Geneva. It was one of Europe’s first joint ventures and now has 22 Member States.

Related links:

CERN’s data centre: https://home.cern/about/computing

Outstanding LHC performance: http://orbiterchspacenews.blogspot.ch/2017/11/record-luminosity-well-done-lhc.html

Data storage milestone: http://orbiterchspacenews.blogspot.ch/2017/07/cern-data-centre-passes-200-petabyte.html

For more information about European Organization for Nuclear Research (CERN), Visit: http://home.cern/

Image (mentioned), Text, Credits: CERN/Harriet Jarlett.

Best regards, Orbiter.ch

NASA Sends New Research to Space Station Aboard SpaceX Resupply Mission


SpaceX - CRS-13 Mission patch.

Dec. 15, 2017


Image above: The SpaceX Dragon spacecraft successfully launched at 10:36 a.m. EST Dec. 15, 2017, from Cape Canaveral Air Force Station in Florida, carrying more than 4,800 pounds of research equipment, cargo and supplies to the International Space Station. Image Credits: NASA TV.

An experiment in space manufacturing and an enhanced study of solar energy are among the research currently heading to the International Space Station following Friday’s launch of a SpaceX Dragon spacecraft at 10:36 a.m. EST.

Dragon lifted off on a Falcon 9 rocket from Space Launch Complex 40 at Cape Canaveral Air Force Station in Florida with more than 4,800 pounds of research equipment, cargo and supplies that will support dozens of the more than 250 investigations aboard the space station.

US Commercial Cargo Ship Sets Sail to the Space Station

NASA astronauts Mark Vande Hei and Joe Acaba will use the space station’s robotic arm to capture Dragon when it arrives at the station. Live coverage of the rendezvous and capture will air on NASA Television and the agency’s website beginning at 4:30 a.m. Sunday, Dec. 17. Installation coverage is set to begin at 7:30 a.m.

Research materials flying inside Dragon's pressurized area include an investigation demonstrating the benefits of manufacturing fiber optic filaments in a microgravity environment. Designed by the company Made in Space, and sponsored by the Center for the Advancement of Science in Space (CASIS), the investigation will attempt to pull fiber optic wire from ZBLAN, a heavy metal fluoride glass commonly used to make fiber optic glass. Results from this investigation could lead to the production of higher-quality fiber optic products for use in space and on Earth.

NASA's Total and Spectral Solar Irradiance Sensor, or TSIS-1, will measure the Sun's energy input to Earth. TSIS-1 measurements will be three times more accurate than previous capabilities, enabling scientists to study the Sun’s natural influence on Earth’s ozone, atmospheric circulation, clouds and ecosystems. These observations are essential for a scientific understanding of the effects of solar variability on the Earth system.

SpaceX Dragon space cargo (SpaceX CRS-9). Image Credit: NASA

The Space Debris Sensor (SDS) will measure the orbital debris environment around the space station for two to three years. Once mounted on the exterior of the station, this one-square-meter sensor will provide near-real-time debris impact detection and recording. Research from this investigation could help lower the risks posed by orbital debris to human life and critical hardware.

This is SpaceX’s 13th cargo flight to the space station under NASA’s Commercial Resupply Services contract. Dragon is scheduled to depart the station in January 2018 and return to Earth with more than 3,600 pounds of research, hardware and crew supplies.

For more than 17 years, humans have lived and worked continuously aboard the International Space Station, advancing scientific knowledge and demonstrating new technologies, making research breakthroughs not possible on Earth that will enable long-duration human and robotic exploration into deep space. A global endeavor, more than 200 people from 18 countries have visited the unique microgravity laboratory that has hosted more than 2,100 research investigations from researchers in more than 95 countries.

Get breaking news, images and features from the space station on social media at:

https://instagram.com/iss and https://www.twitter.com/Space_Station

Related links:

Total and Spectral Solar Irradiance Sensor, or TSIS-1: http://www.nasa.gov/tsis-1

The Space Debris Sensor (SDS): https://www.nasa.gov/mission_pages/station/research/experiments/2145.html

Center for the Advancement of Science in Space (CASIS): http://www.iss-casis.org/

SpaceX: http://www.nasa.gov/spacex

Commercial Resupply: http://www.nasa.gov/mission_pages/station/structure/launch/index.html

International Space Station (ISS): https://www.nasa.gov/mission_pages/station/main/index.html

Images (mentioned), Video, Text, Credits: NASA/Cheryl Warner/Karen Northon/JSC/Dan Huot/NASA TV.

Greetings, Orbiter.ch

jeudi 14 décembre 2017

Artificial Intelligence, NASA Data Used to Discover Eighth Planet Circling Distant Star


NASA - Kepler Space Telescope patch.

Dec. 14, 2017


Image above: With the discovery of an eighth planet, the Kepler-90 system is the first to tie with our solar system in number of planets. Image Credits: NASA/Wendy Stenzel.

Our solar system now is tied for most number of planets around a single star, with the recent discovery of an eighth planet circling Kepler-90, a Sun-like star 2,545 light-years from Earth. The planet was discovered in data from NASA’s Kepler Space Telescope.

The newly-discovered Kepler-90i – a sizzling hot, rocky planet that orbits its star once every 14.4 days – was found using machine learning from Google. Machine learning is an approach to artificial intelligence in which computers “learn.” In this case, computers learned to identify planets by finding in Kepler data instances where the telescope recorded signals from planets beyond our solar system, known as exoplanets.

Artificial Intelligence and NASA Data Used to Discover Eighth Planet Circling Distant Star

Video above: Our solar system now is tied for most number of planets around a single star, with the recent discovery of an eighth planet circling Kepler-90, a Sun-like star 2,545 light years from Earth. The planet was discovered in data from NASA’s Kepler Space Telescope. Video Credit: NASA.

“Just as we expected, there are exciting discoveries lurking in our archived Kepler data, waiting for the right tool or technology to unearth them,” said Paul Hertz, director of NASA’s Astrophysics Division in Washington. “This finding shows that our data will be a treasure trove available to innovative researchers for years to come.”

The discovery came about after researchers Christopher Shallue and Andrew Vanderburg trained a computer to learn how to identify exoplanets in the light readings recorded by Kepler – the minuscule change in brightness captured when a planet passed in front of, or transited, a star. Inspired by the way neurons connect in the human brain, this artificial “neural network” sifted through Kepler data and found weak transit signals from a previously-missed eighth planet orbiting Kepler-90, in the constellation Draco.

While machine learning has previously been used in searches of the Kepler database, this research demonstrates that neural networks are a promising tool in finding some of the weakest signals of distant worlds. 

Other planetary systems probably hold more promise for life than Kepler-90. About 30 percent larger than Earth, Kepler-90i is so close to its star that its average surface temperature is believed to exceed 800 degrees Fahrenheit, on par with Mercury. Its outermost planet, Kepler-90h, orbits at a similar distance to its star as Earth does to the Sun.

“The Kepler-90 star system is like a mini version of our solar system. You have small planets inside and big planets outside, but everything is scrunched in much closer,” said Vanderburg, a NASA Sagan Postdoctoral Fellow and astronomer at the University of Texas at Austin.

Shallue, a senior software engineer with Google’s research team Google AI, came up with the idea to apply a neural network to Kepler data. He became interested in exoplanet discovery after learning that astronomy, like other branches of science, is rapidly being inundated with data as the technology for data collection from space advances.

“In my spare time, I started googling for ‘finding exoplanets with large data sets’ and found out about the Kepler mission and the huge data set available,” said Shallue. "Machine learning really shines in situations where there is so much data that humans can't search it for themselves.”

Kepler’s four-year dataset consists of 35,000 possible planetary signals. Automated tests, and sometimes human eyes, are used to verify the most promising signals in the data. However, the weakest signals often are missed using these methods. Shallue and Vanderburg thought there could be more interesting exoplanet discoveries faintly lurking in the data.

Kepler Space Telescope. Image Credit: NASA

First, they trained the neural network to identify transiting exoplanets using a set of 15,000 previously-vetted signals from the Kepler exoplanet catalogue. In the test set, the neural network correctly identified true planets and false positives 96 percent of the time. Then, with the neural network having "learned" to detect the pattern of a transiting exoplanet, the researchers directed their model to search for weaker signals in 670 star systems that already had multiple known planets. Their assumption was that multiple-planet systems would be the best places to look for more exoplanets.

“We got lots of false positives of planets, but also potentially more real planets,” said Vanderburg. “It’s like sifting through rocks to find jewels. If you have a finer sieve then you will catch more rocks but you might catch more jewels, as well.”

Kepler-90i wasn’t the only jewel this neural network sifted out. In the Kepler-80 system, they found a sixth planet. This one, the Earth-sized Kepler-80g, and four of its neighboring planets form what is called a resonant chain – where planets are locked by their mutual gravity in a rhythmic orbital dance. The result is an extremely stable system, similar to the seven planets in the TRAPPIST-1 system.

Their research paper reporting these findings has been accepted for publication in The Astronomical Journal. Shallue and Vanderburg plan to apply their neural network to Kepler’s full set of more than 150,000 stars.

Kepler has produced an unprecedented data set for exoplanet hunting. After gazing at one patch of space for four years, the spacecraft now is operating on an extended mission and switches its field of view every 80 days.

“These results demonstrate the enduring value of Kepler’s mission,” said Jessie Dotson, Kepler’s project scientist at NASA’s Ames Research Center in California’s Silicon Valley. “New ways of looking at the data – such as this early-stage research to apply machine learning algorithms – promises to continue to yield significant advances in our understanding of planetary systems around other stars. I’m sure there are more firsts in the data waiting for people to find them.”

Ames manages the Kepler and K2 missions for NASA’s Science Mission Directorate in Washington. NASA's Jet Propulsion Laboratory in Pasadena, California, managed Kepler mission development. Ball Aerospace & Technologies Corporation operates the flight system with support from the Laboratory for Atmospheric and Space Physics at the University of Colorado in Boulder. This work was performed through the Carl Sagan Postdoctoral Fellowship Program executed by the NASA Exoplanet Science Institute.

Related links:

The Astronomical Journal: https://www.cfa.harvard.edu/~avanderb/kepler90i.pdf

TRAPPIST-1 system: https://exoplanets.nasa.gov/news/1419/nasa-telescope-reveals-largest-batch-of-earth-size-habitable-zone-planets-around-single-star/

For more information on this announcement, visit: https://www.nasa.gov/mediaresources

For more information about the Kepler mission, visit: https://www.nasa.gov/kepler

Images (mentioned), Video (mentioned), Text, Credits: NASA/Felicia Chou/Karen Northon/Ames Research Center/Alison Hawkes.

Greetings, Orbiter.ch

Dawn of a galactic collision


ESA - Hubble Space Telescope logo.

14 December 2017

An ongoing cosmic collision

A riot of colour and light dances through this peculiarly shaped galaxy, NGC 5256. Its smoke-like plumes are flung out in all directions and the bright core illuminates the chaotic regions of gas and dust swirling through the galaxy’s centre. Its odd structure is due to the fact that this is not one galaxy, but two — in the process of a galactic collision.

NGC 5256, also known as Markarian 266, is about 350 million light-years away from Earth, in the constellation of Ursa Major (The Great Bear) [1]. It is composed of two disc galaxies whose nuclei are currently just 13 000 light-years apart. Their constituent gas, dust, and stars are swirling together in a vigorous cosmic blender, igniting newborn stars in bright star formation regions across the galaxy.

 NGC 5256 (ground-based view)

Interacting galaxies can be found throughout the Universe, producing a variety of intricate structures. Some are quiet, with one galaxy nonchalantly absorbing another. Others are violent and chaotic, switching on quasars, detonating supernovae, and triggering bursts of star formation.

While these interactions are destructive on a galactic scale, stars very rarely collide with each other in this process because the distances between them are so vast. But as the galaxies entangle themselves, strong tidal effects produce new structures — like the chaotic-looking plumes of NGC 5256 — before settling into a stable arrangement after millions of years.

NGC 5256

In addition to the bright and chaotic features, each merging galaxy of NGC 5256 contains an active galactic nucleus, where gas and other debris are fed into a hungry supermassive black hole. Observations from NASA’s Chandra X-ray Observatory show that both of these nuclei — and the region of hot gas between them — have been heated by shock waves created as gas clouds collide at high velocities.

Hubble Space Telescope

Galaxy mergers, like the one NGC 5256 is currently experiencing, were more common early in the Universe and are thought to drive galactic evolution. Today most galaxies show signs of past mergers and near-collisions. Our own Milky Way too has a long history of interaction: it contains the debris of many smaller galaxies it has absorbed in the past; it is currently cannibalising the Sagittarius Dwarf Spheroidal Galaxy; and in a kind of cosmic payback, the Milky Way will merge with our neighbour, the Andromeda Galaxy in about two billion years.

Zoom on NGC 5256

Also in this Hubble image is another pair of probably interacting galaxies — they are hiding to the right of NGC 5256 in the far distance, and have not yet been explored by any astronomer. From our perspective here on Earth, NGC 5256 is also just a few degrees away from another famous pair of interacting galaxies, Messier 51, which was observed by Hubble in 2005 (heic0506).

Pan across NGC 5256

Notes:

[1] NGC 5256 has previously been imaged by Hubble as part of a collection of 59 images of merging galaxies, released on Hubble’s 18th anniversary on 24 April 2008. This new image adds H-alpha data taken from the Wide-Field Camera 3 to the previously available data, making the gas visible.

More information:

The Hubble Space Telescope is a project of international cooperation between ESA and NASA.

Links:

Images of Hubble:http://www.spacetelescope.org/images/archive/category/spacecraft/

heic0506: https://www.spacetelescope.org/news/heic0506/

ESA's Hubble website: http://www.spacetelescope.org/

NASA’s Chandra X-ray Observatory: http://chandra.si.edu/

Images, Animation, Text, Videos,  Credits: NASA, ESA/Mathias Jäger/The Hubble Heritage Team (STScI/AURA)-ESA/Hubble Collaboration and A. Evans (University of Virginia, Charlottesville/NRAO/Stony Brook University).


Best regards, Orbiter.ch

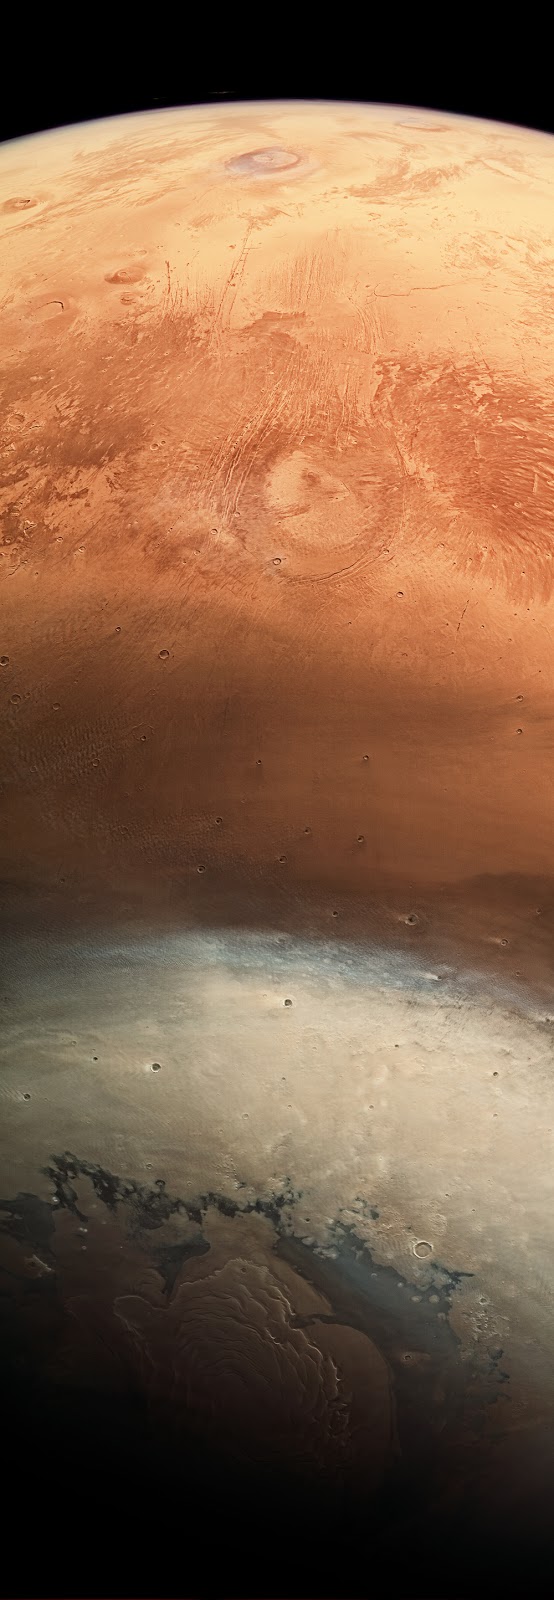
Mars upside down


ESA - Mars Express Mission patch.

14 December 2017

Mars Express

Which way is up in space? Planets are usually shown with the north pole at the top and the south pole at the bottom. In this remarkable image taken by ESA’s Mars Express, the Red Planet is seen with north at the bottom, and the equator at the top.

The image was taken on 19 June for calibrating the high-resolution stereo camera, while Mars Express was flying from north to south. The camera’s nine channels – one downward-pointing, four colour and four stereo – panned over the surface to record a large area with the same illumination conditions. At the same time, the camera was shifted to the horizon, instead of just pointing to the surface as in routine imaging.

North to south

The result is this rare wide-angle view of the planet, with the illuminated horizon near the equator at the top of the image, and the shadowed north pole at the bottom.

The northern polar cap was composed of water ice and dust at the time of imaging, at the beginning of spring. The carbon dioxide ice present in winter had already evaporated from the solid form to a gas. Similarly, water-ice also evaporates, injecting a large amount of water into the atmosphere that is circulated to the south by atmospheric motions. When the seasons change back, carbon dioxide frost and water-ice build up again. 

Panning south, the view soaks up sights of some of the planet’s largest volcanoes in the Tharsis region. Tharsis covers an area larger than Europe, and rises some 5 km above the planet’s average elevation, with volcanoes towering 10–22 km in height.

The largest volcanic giant, Olympus Mons, is out of view in this scene, leaving Alba Mons to take centre stage in the top half of the image, with a diameter of more than 1000 km.

Mars global context

Alba Mons lies at the edge of the Tharsis uplift, and a number of parallel linear features can be seen around it, their formation tied to the tectonic stresses of the Tharsis bulge. As the region swelled with magma in the planet’s first billion years of history the crust was stretched apart. Later, when subsurface magma chambers were discharged, subsidence of the crust also generated fractures.

Further towards the horizon, the 15 km-high Ascraeus Mons comes into view, on this occasion covered by hazy clouds.

Thin layers of clouds can also be seen several tens of kilometres above the horizon.

Mars topography

Other volcanoes can also be seen to the left of Ascraeus Mons, including Uranius Mons, Ceraunius Tholus and Tharsis Tholus.

Although average in size by martian standards, with diameters between about 60 km and 150 km, and towering between about 5 km and 8 km above the surrounding terrain, they rival many of Earth’s volcanoes: Mauna Kea is the tallest volcano on Earth at 10 km when measured from its oceanic base to summit, with only 4200 m above sea level.

Related links:

Mars Express: http://www.esa.int/Our_Activities/Space_Science/Mars_Express

Mars Express overview: http://www.esa.int/Our_Activities/Space_Science/Mars_Express_overview

Mars Express in-depth: http://sci.esa.int/marsexpress

ESA Planetary Science archive (PSA): http://www.rssd.esa.int/PSA

High Resolution Stereo Camera: http://berlinadmin.dlr.de/Missions/express/indexeng.shtml

HRSC data viewer: http://hrscview.fu-berlin.de/

Behind the lens... http://www.esa.int/Our_Activities/Space_Science/Mars_Express/Behind_the_lens

Frequently asked questions: http://www.esa.int/Our_Activities/Space_Science/Mars_Express/Frequently_asked_questions

Images, Text, Credits: ESA/NASA/MGS/MOLA Science Team, FU Berlin.

Best regards, Orbiter.ch

Mars Mission Sheds Light on Habitability of Distant Planets


NASA - MAVEN Mission patch.

December 14, 2017

How long might a rocky, Mars-like planet be habitable if it were orbiting a red dwarf star? It's a complex question but one that NASA's Mars Atmosphere and Volatile Evolution mission can help answer.

"The MAVEN mission tells us that Mars lost substantial amounts of its atmosphere over time, changing the planet's habitability," said David Brain, a MAVEN co-investigator and a professor at the Laboratory for Atmospheric and Space Physics at the University of Colorado Boulder. "We can use Mars, a planet that we know a lot about, as a laboratory for studying rocky planets outside our solar system, which we don't know much about yet."


Image above: This illustration depicts charged particles from a solar storm stripping away charged particles of Mars' atmosphere, one of the processes of Martian atmosphere loss studied by NASA's MAVEN mission, beginning in 2014. Unlike Earth, Mars lacks a global magnetic field that could deflect charged particles emanating from the Sun. Image credits: NASA/GSFC.

At the fall meeting of the American Geophysical Union on Dec. 13, 2017, in New Orleans, Louisiana, Brain described how insights from the MAVEN mission could be applied to the habitability of rocky planets orbiting other stars.

MAVEN carries a suite of instruments that have been measuring Mars' atmospheric loss since November 2014. The studies indicate that Mars has lost the majority of its atmosphere to space over time through a combination of chemical and physical processes. The spacecraft's instruments were chosen to determine how much each process contributes to the total escape.

In the past three years, the Sun has gone through periods of higher and lower solar activity, and Mars also has experienced solar storms, solar flares and coronal mass ejections. These varying conditions have given MAVEN the opportunity to observe Mars' atmospheric escape getting cranked up and dialed down.

Brain and his colleagues started to think about applying these insights to a hypothetical Mars-like planet in orbit around some type of M-star, or red dwarf, the most common class of stars in our galaxy.

The researchers did some preliminary calculations based on the MAVEN data. As with Mars, they assumed that this planet might be positioned at the edge of the habitable zone of its star. But because a red dwarf is dimmer overall than our Sun, a planet in the habitable zone would have to orbit much closer to its star than Mercury is to the Sun.

The brightness of a red dwarf at extreme ultraviolet (UV) wavelengths combined with the close orbit would mean that the hypothetical planet would get hit with about 5 to 10 times more UV radiation than the real Mars does. That cranks up the amount of energy available to fuel the processes responsible for atmospheric escape. Based on what MAVEN has learned, Brain and colleagues estimated how the individual escape processes would respond to having the UV cranked up.

Their calculations indicate that the planet's atmosphere could lose 3 to 5 times as many charged particles, a process called ion escape. About 5 to 10 times more neutral particles could be lost through a process called photochemical escape, which happens when UV radiation breaks apart molecules in the upper atmosphere.


Image above: To receive the same amount of starlight as Mars receives from our Sun, a planet orbiting an M-type red dwarf would have to be positioned much closer to its star than Mercury is to the Sun. Image credits: NASA/GSFC.

Because more charged particles would be created, there also would be more sputtering, another form of atmospheric loss. Sputtering happens when energetic particles are accelerated into the atmosphere and knock molecules around, kicking some of them out into space and sending others crashing into their neighbors, the way a cue ball does in a game of pool.

Finally, the hypothetical planet might experience about the same amount of thermal escape, also called Jeans escape. Thermal escape occurs only for lighter molecules, such as hydrogen. Mars loses its hydrogen by thermal escape at the top of the atmosphere. On the exo-Mars, thermal escape would increase only if the increase in UV radiation were to push more hydrogen to the top of the atmosphere.

Altogether, the estimates suggest that orbiting at the edge of the habitable zone of a quiet M-class star, instead of our Sun, could shorten the habitable period for the planet by a factor of about 5 to 20. For an M-star whose activity is amped up like that of a Tasmanian devil, the habitable period could be cut by a factor of about 1,000 -- reducing it to a mere blink of an eye in geological terms. The solar storms alone could zap the planet with radiation bursts thousands of times more intense than the normal activity from our Sun.

However, Brain and his colleagues have considered a particularly challenging situation for habitability by placing Mars around an M-class star. A different planet might have some mitigating factors -- for example, active geological processes that replenish the atmosphere to a degree, a magnetic field to shield the atmosphere from stripping by the stellar wind, or a larger size that gives more gravity to hold on to the atmosphere.

MAVEN spacecraft. Image Credit: NASA

"Habitability is one of the biggest topics in astronomy, and these estimates demonstrate one way to leverage what we know about Mars and the Sun to help determine the factors that control whether planets in other systems might be suitable for life," said Bruce Jakosky, MAVEN's principal investigator at the University of Colorado Boulder.

MAVEN's principal investigator is based at the University of Colorado's Laboratory for Atmospheric and Space Physics, Boulder. The university provided two science instruments and leads science operations, as well as education and public outreach, for the mission. NASA's Goddard Space Flight Center in Greenbelt, Maryland, manages the MAVEN project and provided two science instruments for the mission. NASA's Jet Propulsion Laboratory, a division of Caltech in Pasadena, California, manages the Mars Exploration Program for NASA's Science Mission Directorate, Washington.

For more information about MAVEN, visit: https://www.nasa.gov/maven

Images (mentioned), Text, Credits: NASA/Laurie Cantillo/Dwayne Brown/GSFC/Written by Elizabeth Zubritsky.

Greetings, Orbiter.ch

Expedition 53 Crewmates Return to Earth From Space Station


ROSCOSMOS - Soyuz MS-05 Mission patch.

Dec. 14, 2017

Three crew members who have been living and working aboard the International Space Station returned to Earth on Thursday, landing in Kazakhstan after opening a new chapter in the scientific capability of humanity’s premier microgravity laboratory.

Expedition 53 Commander Randy Bresnik of NASA and Flight Engineers Paolo Nespoli of ESA (European Space Agency) and Sergey Ryazanskiy of Roscosmos landed at 3:37 a.m. EST (2:37 p.m. Kazakhstan time) southeast of the remote town of Dzhezkazgan in Kazakhstan.


Image above: The Soyuz MS-05 spacecraft is seen as it lands with Expedition 53 Commander Randy Bresnik of NASA and Flight Engineers Paolo Nespoli of ESA (European Space Agency) and Sergey Ryazanskiy of the Russian space agency Roscosmos in Kazakhstan on Thursday, December 14, 2017. Bresnik, Nespoli and Ryazanskiy are returning after 138 days in space where they served as members of the Expedition 52 and 53 crews aboard the International Space Station. Photo Credits: (NASA/Bill Ingalls).

Together, the Expedition 53 crew members contributed to hundreds of experiments in biology, biotechnology, as well as Earth and other physical sciences aboard the orbiting laboratory. Their time aboard marked the first long-term increase in crew size on the U.S. segment of the International Space Station from three to four, allowing NASA to maximize time dedicated to research on the station.

Highlights from the research conducted while they were aboard include investigations of microgravity’s effect on the antibiotic resistance of E. coli, a bacterial pathogen responsible for urinary tract infection in humans and animals;  growing larger versions of an important protein implicated in Parkinson’s disease; and delivering a new instrument to address fundamental science questions on the origins and history of cosmic rays.

Paolo thumbs up. Image Credit: NASA TV.

The trio also welcomed three cargo spacecraft delivering several tons of supplies and research experiments. Orbital ATK’s Cygnus spacecraft arrived at station in November as the company's eighth commercial resupply mission. One Russian ISS Progress cargo craft docked to the station in October. And a SpaceX Dragon completed its commercial resupply mission to station in August, the company’s twelfth resupply mission.

During his time on the orbital complex, Bresnik ventured outside the confines of the space station for three spacewalks. Along with NASA astronauts Mark Vande Hei and Joe Acaba, Bresnik lead a trio of spacewalks to replace one of two latching end effectors on the station’s robotic arm, Canadarm2. They also spent time lubricating the newly replaced Canadarm2 end effector and replacing cameras on the left side of the station’s truss and the right side of the station’s U.S. Destiny laboratory.

Ryazanskiy conducted one spacewalk with fellow cosmonaut Fyodor Yurchikhin in August to deploy several nanosatellites, collect research samples, and perform structural maintenance.

The Expedition 54 crew continues operating the station, with Alexander Misurkin of Roscosmos in command. Along with crewmates Mark Vende Hei and Joe Acaba of NASA, the three-person crew will operate the station until the arrival of three new crew members on Tuesday, Dec. 19.

Scott Tingle of NASA, Anton Shkaplerov of Roscosmos and Norishige Kanai of the Japan Aerospace Exploration Agency (JAXA), are scheduled to launch Sunday, Dec. 17 from Baikonur, Kazakhstan. NASA Television will broadcast the launch and docking: https://www.nasa.gov/press-release/nasa-television-coverage-set-for-space-station-crew-landing-launch

Related links:

Microgravity’s effect on the antibiotic resistance of E. coli: https://www.nasa.gov/centers/ames/engineering/projects/ecamsat

Protein implicated in Parkinson’s disease: https://www.nasa.gov/mission_pages/station/research/experiments/2295.html

Origins and history of cosmic rays: https://www.nasa.gov/mission_pages/station/research/experiments/2295.html

Expedition 53: https://www.nasa.gov/mission_pages/station/expeditions/expedition53/index.html

International Space Station (ISS): https://www.nasa.gov/mission_pages/station/main/index.html

Images (mentioned), Text, Credits: NASA/Tabatha Thompson/Allard Beutel/JSC/Dan Huot.

Best regards, Orbiter.ch

mercredi 13 décembre 2017

Two tales of one galaxy, Gaia's view of our galactic neighbours


ESA - Gaia Mission patch.

13 December 2017

Measuring the positions and motions of more than a billion stars, ESA's Gaia mission will refine our knowledge about our place in the Universe, providing the best ever star chart of our Milky Way and its neighbouring galaxies.


Image above: Gaia's view of the Large Magellanic Cloud. Click here for details and larger versions of the image. Image Credits: ESA/Gaia/DPAC.

One of the nearest galaxies to our Galaxy is the Large Magellanic Cloud (LMC), located around 166 000 light-years away and visible to the naked eye at intermediate and southern latitudes.

With a mass roughly equivalent to ten billion times the mass of our Sun – about one tenth of the Milky Way – the LMC is home to an intense star-forming activity, forming stars five time faster than in our Galaxy. Different aspects of the galaxy's stellar population are depicted in these two images, based on data collected by the Gaia satellite during its first 14 months of operations.

The view on the left, compiled by mapping the total density of stars detected by Gaia in each pixel of the image, shows the large-scale distribution of stars in the LMC, delineating the extent of the spiral arms. The image is peppered with bright dots – these are faint clusters of stars.

A series of diagonal stripes, visible along the central thick structure, or bar, are an artefact caused by Gaia's scanning procedure. These will gradually decrease as more data are gathered throughout the lifetime of the mission.

On the right, a different image provides a complementary view that reveals other aspects of this galaxy and its stars. Created by mapping the total amount of radiation, or flux, recorded per pixel by Gaia, this image is dominated by the brightest, most massive stars, which greatly outshine their fainter, lower-mass counterparts. In this view, the bar of the LMC is more clearly delineated, alongside individual regions of star formation like the sparkling 30 Doradus, visible just above the centre of the galaxy.

The images below, also obtained using data from the first 14 months of Gaia science operations, depict two nearby spiral galaxies: Andromeda (also known as M31), which is slightly more massive than the Milky Way and, at roughly 2.5 million light-years away, the largest galaxy in our vicinity; and its neighbour, the Triangulum galaxy (also known as M33) home to some fifty billion stars and located about 2.8 million light-years away.


Image above: Gaia's view of the Andromeda galaxy. Image Credits: ESA/Gaia/DPAC.

As in the case of the LMC, the image on the left is based on the total density of stars, and shows where stars of all types are located, while the image on the right is based on the flux and mainly depicts the bright end of the stellar population of each galaxy, tracing out the regions of most intense star formation.


Image above: Gaia's view of the Triangulum galaxy.  Credits: ESA/Gaia/DPAC.

The first batch of Gaia data, released in 2016 and based on 14 months of science operations, contained the position and brightness of more than one billion stars. Most of these stars are located in the Milky Way, but a good fraction are extragalactic, with around ten million belonging to the LMC.

For all these stars and more, the second release of Gaia data – planned for April 2018 – will also contain measurements of their parallax, which quantifies a star's distance from us, and of their motion across the sky. Astronomers are eagerly awaiting this unprecedented data set to delve into the present and past mysteries of our Galaxy and its neighbours.

By analysing the motions of individual stars in external galaxies like the LMC, Andromeda, or Triangulum, it will be possible to learn more about the overall rotation of stars within these galaxies, as well as the orbit of the galaxies themselves in the swarm they are part of, known as the Local Group.

In the case of the LMC, a team of astronomers have already attempted to do so by using a subset of data from the first Gaia release, the Tycho–Gaia Astrometric Solution (TGAS), for which parallaxes and proper motions had also been provided by combining the new data with those from ESA's first astrometry mission, Hipparcos. In the TGAS data set, consisting of two million stars, they identified 29 stars in the LMC with good measurements of proper motions and used them to estimate the rotation of the galaxy, providing a taster of the studies that will become possible with future releases of Gaia data.

Gaia. Image Credit: ESA

Observations of the LMC and its neighbour, the Small Magellanic Cloud (SMC), with Gaia are extremely important also for studying variable stars like Cepheids and RR Lyrae. These stars can be used as indicators of cosmic distances in galaxies beyond our own as long as they are first calibrated in a 'local' laboratory, such as the LMC and SMC, where it is possible to obtain a more direct estimate of their distance using parallax determined with Gaia.

Astronomers in the Gaia Data Processing and Analysis Consortium, or DPAC, tested this method on hundreds of LMC variable stars from the TGAS sample as part of the validation of the data from the first release. Their results, which are promising even though preliminary, are an exciting example of the rich scientific harvest that will be possible with future releases of the data that are being gathered by Gaia.

Related links:

ESA Gaia: http://sci.esa.int/gaia/

Gaia Data Processing and Analysis Consortium (DPAC): https://www.cosmos.esa.int/web/gaia/dpac

Images (mentioned), Text, Credit: European Space Agency (ESA).

Greetings, Orbiter.ch

Stellar Nursery Blooms into View


ESO - European Southern Observatory logo.

13 December 2017

Stellar Nursery Blooms into View

The OmegaCAM camera on ESO’s VLT Survey Telescope has captured this glittering view of the stellar nursery called Sharpless 29. Many astronomical phenomena can be seen in this giant image, including cosmic dust and gas clouds that reflect, absorb, and re-emit the light of hot young stars within the nebula.

The region of sky pictured is listed in the Sharpless catalogue of H II regions: interstellar clouds of ionised gas, rife with star formation. Also known as Sh 2-29, Sharpless 29 is located about 5500 light-years away in the constellation of Sagittarius (The Archer), next door to the larger Lagoon Nebula. It contains many astronomical wonders, including the highly active star formation site of NGC 6559, the nebula at the centre of the image.

The star formation region NGC 6559 in the constellation of Sagittarius

This central nebula is Sharpless 29’s most striking feature. Though just a few light-years across, it showcases the havoc that stars can wreak when they form within an interstellar cloud. The hot young stars in this image are no more than two million years old and are blasting out streams of high-energy radiation. This energy heats up the surrounding dust and gas, while their stellar winds dramatically erode and sculpt their birthplace. In fact, the nebula contains a prominent cavity that was carved out by an energetic binary star system. This cavity is expanding, causing the interstellar material to pile up and create the reddish arc-shaped border.

When interstellar dust and gas are bombarded with ultraviolet light from hot young stars, the energy causes them to shine brilliantly. The diffuse red glow permeating this image comes from the emission of hydrogen gas, while the shimmering blue light is caused by reflection and scattering off small dust particles. As well as emission and reflection, absorption takes place in this region. Patches of dust block out the light as it travels towards us, preventing us from seeing the stars behind it, and smaller tendrils of dust create the dark filamentary structures within the clouds.

The rich surroundings of Sharpless 29

The rich and diverse environment of Sharpless 29 offers astronomers a smorgasbord of physical properties to study. The triggered formation of stars, the influence of the young stars upon dust and gas, and the disturbance of magnetic fields can all be observed and examined in this single area.

But young, massive stars live fast and die young. They will eventually explosively end their lives in a supernova, leaving behind rich debris of gas and dust. In tens of millions of years, this will be swept away and only an open cluster of stars will remain.

Zooming in on the star-forming region Sharpless 29

Sharpless 29 was observed with ESO’s OmegaCAM on the VLT Survey Telescope (VST) at Cerro Paranal in Chile. OmegaCAM produces images that cover an area of sky more than 300 times greater than the largest field of view imager of the NASA/ESA Hubble Space Telescope, and can observe over a wide range of wavelengths from the ultraviolet to the infrared. Its hallmark feature is its ability to capture the very red spectral line H-alpha, created when the electron inside a hydrogen atom loses energy, a prominent occurrence in a nebula like Sharpless 29.

Panning across the VST’s view of Sharpless 29

More information:

ESO is the foremost intergovernmental astronomy organisation in Europe and the world’s most productive ground-based astronomical observatory by far. It is supported by 16 countries: Austria, Belgium, Brazil, the Czech Republic, Denmark, France, Finland, Germany, Italy, the Netherlands, Poland, Portugal, Spain, Sweden, Switzerland and the United Kingdom, along with the host state of Chile and by Australia as a strategic partner. ESO carries out an ambitious programme focused on the design, construction and operation of powerful ground-based observing facilities enabling astronomers to make important scientific discoveries. ESO also plays a leading role in promoting and organising cooperation in astronomical research. ESO operates three unique world-class observing sites in Chile: La Silla, Paranal and Chajnantor. At Paranal, ESO operates the Very Large Telescope, the world’s most advanced visible-light astronomical observatory and two survey telescopes. VISTA works in the infrared and is the world’s largest survey telescope and the VLT Survey Telescope is the largest telescope designed to exclusively survey the skies in visible light. ESO is a major partner in ALMA, the largest astronomical project in existence. And on Cerro Armazones, close to Paranal, ESO is building the 39-metre Extremely Large Telescope, the ELT, which will become “the world’s biggest eye on the sky”.

Links:

Photos of OmegaCAM: http://www.eso.org/public/images/archive/search/?adv=&subject_name=OmegaCAM

Photos of VST: http://www.eso.org/public/images/archive/search/?adv=&subject_name=VLT%20Survey%20Telescope

VLT Survey Telescope (VST): http://www.eso.org/public/teles-instr/paranal-observatory/surveytelescopes/vst/

NASA/ESA Hubble Space Telescope: http://www.spacetelescope.org/

ESOcast 142 Light: Stellar Nursery Blooms into View (4K UHD): http://www.eso.org/public/videos/eso1740a/

Images, Videos, Text, Credits: ESO/Richard Hook//M. Kornmesser/IAU and Sky & Telescope.

Greetings, Orbiter.ch

Blue Origin - Crew Capsule 2.0 First Flight


Blue Origin logo.

13 December 2017

New Shepard flew again for the seventh time on Dec. 12, 2017, from Blue Origin’s West Texas Launch Site. Known as Mission 7 (M7), the mission featured the next-generation booster and the first flight of Crew Capsule 2.0.

Crew Capsule 2.0 First Flight

Crew Capsule 2.0 features large windows, measuring 2.4 feet wide, 3.6 feet tall. M7 also included 12 commercial, research and education payloads onboard.

Crew Capsule 2.0

Crew Capsule 2.0 reached an apogee of 322,405 feet AGL/326,075 feet MSL (98.27 kilometers AGL/99.39 kilometers MSL). The booster reached an apogee of 322,032 feet AGL/325,702 feet MSL (98.16 kilometers AGL/99.27 kilometers MSL).

For more information, visit: https://www.blueorigin.com/

Image, Video, Text, Credits: Blue Origin.

Best regards, Orbiter.ch

Giant storms cause palpitations in Saturn's atmospheric heartbeat


ESA - Cassini Mission to Saturn logo.

13 December 2017

Immense northern storms on Saturn can disturb atmospheric patterns at the planet's equator, finds the international Cassini mission. This effect is also seen in Earth's atmosphere, suggesting the two planets are more alike than previously thought.


Video above: Temperature changes at Saturn's equator: 2004-2016. Video Credits: ESA/NASA.

Despite their considerable differences, the atmospheres of Earth, Jupiter, and Saturn all display a remarkably similar phenomenon in their equatorial regions: vertical, cyclical, downwards-moving patterns of alternating temperatures and wind systems that repeat over a period of multiple years.

These patterns–known as the Quasi-Periodic Oscillation (QPO) on Saturn and the Quasi-Quadrennial Oscillation (QQO) on Jupiter, due to their similarities to Earth's so-called Quasi-Biennial Oscillation (QBO)–appear to be a defining characteristic of the middle layers of a planetary atmosphere.

Earth's QBO is regular and predictable, repeating every 28 months on average. However, it can be disrupted by events occurring at great distances from the equator of our planet–and a new study reveals that the same is true of Saturn's QPO.

"These oscillations can be thought of as a planet's heartbeat," says Leigh Fletcher of the University of Leicester, UK, lead author of the study (published in Nature Astronomy) and co-investigator of Cassini's Composite Infrared Spectrometer (CIRS). "Cassini spotted them on Saturn about a decade ago, and Earth-based observations have seen them on Jupiter, too. Although the atmospheres of the distant gas giants may appear startlingly different to our own, when we look closely we start to discover these familiar natural patterns."


Image above: VLT image of a giant anti-cyclone in Saturn's stratosphere on 20 July 2011. Credit: Image courtesy of Leigh N. Fletcher, University of Oxford, UK, and ESO.

Cassini observed Saturn from June 2004 until 15 September 2017 when the mission concluded by plunging into the gas planet's atmosphere. To better understand Saturn's QPO, Fletcher and colleagues studied data from Cassini's CIRS covering this entire time period.

"We looked at data of Saturn's 'heartbeat', which repeats roughly every 15 Earth years, and found a huge disturbance–a palpitation, to continue the metaphor–spanning 2011 to 2013, where the whole equatorial region cooled dramatically," adds co-author Sandrine Guerlet from Laboratoire de Météorologie Dynamique (LMD), France. "When we checked the timing, we realised this happened directly after the eruption of a giant storm that wrapped around Saturn's entire northern hemisphere. This suggests a link between the two events: we think that the wave activity associated with this huge storm headed towards the equator and disrupted the QPO, despite the storm raging tens of thousands of kilometres away!"

This storm was known as the Great Northern Storm. Such storms occur roughly once every Saturnian year, which is equivalent to 30 Earth years. The timing of the storm was thus serendipitous, allowing Cassini to observe it in detail from orbit around the ringed planet.


Image above: Saturn's Great Northern Storm of 2011. Image Credits: NASA/JPL-Caltech/Space Science Institute.

Although the influence of Saturnian storms was known to be substantial, this study suggests an even wider influence than expected, and confirms a connection between Saturn's QPO and remote, distinct events occurring elsewhere in the planet's atmosphere.

"We became especially excited when we compared this palpitation on Saturn to one observed in Earth's QBO in 2016: it was disturbed in a similar way by waves carrying momentum from Earth's northern hemisphere to the equator," adds Fletcher. "That disruption was unprecedented in over 60 years of monitoring the QBO–and yet we were lucky enough to capture a similar behaviour at work on Saturn with Cassini."

On Earth, this relationship between distant events in a planet's climate system is known as teleconnection. Meteorological patterns across the globe are known to be delicately linked together, and can affect one another quite significantly. A key example of this is the El Niño Southern Oscillation, which can influence temperatures and climate patterns across the Earth.


Images above: Saturn's Great Northern Storm in visible light. Image Credits: NASA/JPL-Caltech/Space Science Institute.

"It's remarkable to see this process occurring on another planet within our Solar System–especially one that's so vastly different to our own," says Nicolas Altobelli, ESA Project Scientist for the Cassini-Huygens mission.

"Cassini-Huygens may now have ended its mission, but there's still a wealth of data to explore, and a huge amount of valuable information to be gathered from the spacecraft's observations. As well as telling us more about Saturn, gas giant planets, and the Solar System in general, this study helps us better understand the Earth. This is one key driver of our research into other planets: to discover more about our own."

Notes for Editors:

The paper "Disruption of Saturn's quasi-periodic equatorial oscillation by the Great Northern Storm" by L. N. Fletcher et al. is published in the journal Nature Astronomy. doi:10.1038/s41550-017-0271-5. http://www.nature.com/articles/s41550-017-0271-5

The Principal Investigator of Cassini's Composite Infrared Spectrometer (CIRS) is Michael Flasar (NASA/GSFC, USA).

Cassini-Huygens is a cooperative project of NASA, ESA, and ASI, the Italian space agency.

More information on the mission can be found here: http://sci.esa.int/cassini-huygens

Images (mentioned), Video (mentioned), Text, Credits: ESA/Nicolas Altobelli/Laboratoire de Météorologie Dynamique (LMD)/Sandrine Guerlet/University of Leicester/Leigh Fletcher.

Best regards, Orbiter.ch