samedi 15 juillet 2017

For Moratorium on Sending Commands to Mars, Blame the Sun


JPL - Jet Propulsion Laboratory logo.

July 15, 2017

This month, movements of the planets will put Mars almost directly behind the sun, from Earth's perspective, causing curtailed communications between Earth and Mars.

NASA will refrain from sending commands to America's three Mars orbiters and two Mars rovers during the period from July 22 to Aug. 1.

Geometry of Mars Solar Conjunction

Image above: This diagram illustrates the positions of Mars, Earth and the sun during a period that occurs approximately every 26 months, when Mars passes almost directly behind the sun from Earth's perspective. Image Credits: NASA/JPL-Caltech.

"Out of caution, we won't talk to our Mars assets during that period because we expect significant degradation in the communication link, and we don't want to take a chance that one of our spacecraft would act on a corrupted command," said Chad Edwards, manager of the Mars Relay Network Office at NASA's Jet Propulsion Laboratory, Pasadena, California.

Data will keep coming from Mars to Earth, although loss or corruption of some bits is anticipated and the data will be retransmitted later. "We will continue to receive telemetry, so we will have information every day about the status of the vehicles," Edwards said.

As seen from Earth, Mars periodically passes near the sun about every 26 months, an arrangement called "Mars solar conjunction." During most solar conjunctions, including this year's, Mars does not go directly behind the sun.

Viewers using proper eye protection to watch the total solar eclipse on Aug. 21 will gain a visible lesson in why Mars doesn't need to be directly behind the sun for communications between Earth and Mars to be degraded. The sun's corona, which always extends far from the surface of the sun, becomes visible during total eclipses. It consists of hot, ionized gas, which can interfere with radio waves that pass through it.

To prevent the possibility of the ionized gas near the sun corrupting a command radioed to a spacecraft at Mars, NASA avoids transmitting for a period including several days before and after Mars gets closest to passing behind the sun.

Teams that operate Mars orbiters and rovers have been preparing for weeks in anticipation of the moratorium that will begin on July 22.

"The vehicles will stay active, carrying out commands sent in advance," said Mars Program Chief Engineer Hoppy Price, of JPL. "Orbiters will be making their science observations and transmitting data. The rovers won't be driving, but observations and measurements will continue."

The rover teams are determining the most useful sites for the rovers Curiosity and Opportunity to remain productive during the solar-conjunction period.

All of NASA's active Mars missions have experience from at least one previous solar conjunction. This will be the eighth solar conjunction period for the Mars Odyssey orbiter, the seventh for the Opportunity rover, the sixth for the Mars Reconnaissance Orbiter, the third for the Curiosity rover and the second for the MAVEN orbiter.

Edwards said, "All of these spacecraft are now veterans of conjunction. We know what to expect."

What Happens When the Sun Blocks our Signal?

Video above: How can you communicate with Mars spacecraft when the Sun is in the way? Learn more about 'solar conjunction' in this 60-second video. Video Credits: NASA./JPL.

NASA's five current Mars missions, plus Mars missions scheduled for launches in 2018 and 2020, are part of ambitious robotic exploration to understand Mars, helping to lead the way for sending humans to Mars in the 2030s.

NASA's Goddard Space Flight Center manages the MAVEN project for the principal investigator at the University of Colorado, Boulder, and for the NASA Science Mission Directorate, Washington. JPL, a division of Caltech in Pasadena, manages the Odyssey, Opportunity, Reconnaissance Orbiter, and Curiosity projects, and NASA's Mars Exploration Program, for the Science Mission Directorate. Lockheed Martin Space Systems, Denver, built all three NASA Mars orbiters. For more about NASA's Mars Exploration Program, visit:

https://mars.jpl.nasa.gov

https://www.nasa.gov/mars

Image (mentioned), Video (mentioned), Text, Credits: NASA/Laurie Cantillo/Dwayne Brown/JPL/Guy Webster.

Greetings, Orbiter.ch

vendredi 14 juillet 2017

Eagle eye view of CERN


CERN - European Organization for Nuclear Research logo.

July 14, 2017

On board a racing drone for a tour of CERN

Video Credits: Christophe Madsen - Mike Struik/CERN.

Get a unique perspective of CERN by following this drone’s journey around the laboratory as it flies over the iconic Globe exhibition hall, the site of the ATLAS experiment at the LHC, through the magnet assembly facility, around the computing centre and across the border between France and Switzerland to the ALICE and CMS experiment, and much more.


Image above: A racing drone view of Globe exhibition hall at CERN (image capture from the video). Image Credits: Christophe Madsen - Mike Struik/CERN.

Note:

CERN, the European Organization for Nuclear Research, is one of the world’s largest and most respected centres for scientific research. Its business is fundamental physics, finding out what the Universe is made of and how it works. At CERN, the world’s largest and most complex scientific instruments are used to study the basic constituents of matter — the fundamental particles. By studying what happens when these particles collide, physicists learn about the laws of Nature.

The instruments used at CERN are particle accelerators and detectors. Accelerators boost beams of particles to high energies before they are made to collide with each other or with stationary targets. Detectors observe and record the results of these collisions.

Founded in 1954, the CERN Laboratory sits astride the Franco–Swiss border near Geneva. It was one of Europe’s first joint ventures and now has 22 Member States.

Related links:

Large Hardon Collider (LHC): http://home.cern/topics/large-hadron-collider

ATLAS experiment: https://home.cern/about/experiments/atlas

ALICE expetiment: https://home.cern/about/experiments/alice

CMS experiment: https://home.cern/about/experiments/cms

Computing centre: http://home.cern/about/computing

For more information about European Organization for Nuclear Research (CERN), Visit: http://home.cern/

Image (mentioned), Video (mentioned), Text, Credits: CERN/Corinne Pralavorio.

Best regards from neighbor of CERN (one sees my building in the video), Orbiter.ch

Hubble Spots a Barred Lynx Spiral


NASA - Hubble Space Telescope patch.

July 14, 2017


Discovered by British astronomer William Herschel over 200 years ago, NGC 2500 lies about 30 million light-years away in the northern constellation of Lynx. As this NASA/ESA Hubble Space Telescope image shows, NGC 2500 is a particular kind of spiral galaxy known as a barred spiral, its wispy arms swirling out from a bright, elongated core.

Barred spirals are actually more common than was once thought. Around two-thirds of all spiral galaxies — including the Milky Way — exhibit these straight bars cutting through their centers. These cosmic structures act as glowing nurseries for newborn stars, and funnel material towards the active core of a galaxy. NGC 2500 is still actively forming new stars, although this process appears to be occurring very unevenly. The upper half of the galaxy — where the spiral arms are slightly better defined — hosts many more star-forming regions than the lower half, as indicated by the bright, dotted islands of light.

There is another similarity between NGC 2500 and our home galaxy. Together with Andromeda, Triangulum and many smaller natural satellites, the Milky Way is part of the Local Group of galaxies, a gathering of over 50 galaxies all loosely held together by gravity. NGC 2500 forms a similar group with some of its nearby neighbors, including NGC 2541, NGC 2552, NGC 2537 and the bright, Andromeda-like spiral NGC 2481 (known collectively as the NGC 2841 group).

Hubble Space Telescope

For images and more information about Hubble, visit:

http://hubblesite.org/
http://www.nasa.gov/hubble
http://www.spacetelescope.org/

Image, Animation, Text, Credits: ESA/Hubble/NASA/Sara Blumberg.

Greetings, Orbiter.ch

New Horizons Unveils New Maps and videos of Pluto, Charon on Flyby Anniversary


NASA - New Horizons Mission logo.

July 14, 2017


Image above: Artist's impression of NASA's New Horizons spacecraft, en route to a January 2019 encounter with Kuiper Belt object 2014 MU69. Image Credits: NASA/JHUAPL/SwRI.

On July 14, 2015, NASA’s New Horizons spacecraft made its historic flight through the Pluto system – providing the first close-up images of Pluto and its moons and collecting other data that has transformed our understanding of these mysterious worlds on the solar system’s outer frontier.

Scientists are still analyzing and uncovering data that New Horizons recorded and sent home after the encounter. On the two-year anniversary of the flyby, the team is unveiling a set of  detailed, high-quality global maps of Pluto and its largest moon, Charon.

- New Horizons project science gallery for Pluto: http://pluto.jhuapl.edu/Multimedia/Science-Photos/search.php?form_keywords=42
- New Horizons project science gallery for Charon: http://pluto.jhuapl.edu/Multimedia/Science-Photos/search.php?form_keywords=121

“The complexity of the Pluto system — from its geology to its satellite system to its atmosphere— has been beyond our wildest imagination,” said Alan Stern, New Horizons principal investigator from the Southwest Research Institute in Boulder, Colorado. “Everywhere we turn are new mysteries. These new maps from the landmark exploration of Pluto by NASA’s New Horizons mission in 2015 will help unravel these mysteries and are for everyone to enjoy.”


Images above: Global mosaics of Pluto and Charon projected at 300 meters (985 feet) per pixel have been assembled from most of the highest resolution images obtained by the Long-Range Reconnaissance Imager (LORRI) and the Multispectral Visible Imaging Camera (MVIC) onboard New Horizons. Transparent, colorized stereo topography data generated for the encounter hemispheres of Pluto and Charon have been overlain on the mosaics. Terrain south of about 30°S on Pluto and Charon was in darkness leading up to and during the flyby, so is shown in black. “S” and “T” respectively indicate Sputnik Planitia and Tartarus Dorsa on Pluto, and “C” indicates Caleuche Chasma on Charon. All feature names on Pluto and Charon are informal. Images Credits: NASA/JHUAPL/SwRI/LPI.

NASA Video Soars over Pluto’s Majestic Mountains and Icy Plains

New Horizons Flyover of Pluto

Video Credits: NASA/JHUAPL/SwRI/Paul Schenk and John Blackwell, Lunar and Planetary Institute.

In July 2015, NASA’s New Horizons spacecraft sent home the first close-up pictures of Pluto and its moons – amazing imagery that inspired many to wonder what a flight over the distant worlds’ icy terrain might be like.

Wonder no more. Using actual New Horizons data and digital elevation models of Pluto and its largest moon Charon, mission scientists have created flyover movies that offer spectacular new perspectives of the many unusual features that were discovered and which have reshaped our views of the Pluto system – from a vantage point even closer than the spacecraft itself.

This dramatic Pluto flyover begins over the highlands to the southwest of the great expanse of nitrogen ice plain informally named Sputnik Planitia. The viewer first passes over the western margin of Sputnik, where it borders the dark, cratered terrain of Cthulhu Macula, with the blocky mountain ranges located within the plains seen on the right. The tour moves north past the rugged and fractured highlands of Voyager Terra and then turns southward over Pioneer Terra -- which exhibits deep and wide pits -- before concluding over the bladed terrain of Tartarus Dorsa in the far east of the encounter hemisphere.

New Horizons Flyover of Charon

Video Credits: NASA/JHUAPL/SwRI/Paul Schenk and John Blackwell, Lunar and Planetary Institute.

The equally exciting flight over Charon begins high over the hemisphere New Horizons saw on its closest approach, then descends over the deep, wide canyon of Serenity Chasma. The view moves north, passing over Dorothy Gale crater and the dark polar hood of Mordor Macula. The flight then turns south, covering the northern terrain of Oz Terra before ending over the relatively flat equatorial plains of Vulcan Planum and the “moated mountains” of Clarke Montes.

The topographic relief is exaggerated by a factor of two to three times in these movies to emphasize topography; the surface colors of Pluto and Charon also have been enhanced to bring out detail.

Digital mapping and rendering were performed by Paul Schenk and John Blackwell of the Lunar and Planetary Institute in Houston. All feature names in the Pluto system are informal.

New Horizons continues to speed along toward its next target – the Kuiper Belt object 2014 MU69.

New Horizons: http://www.nasa.gov/mission_pages/newhorizons/main/index.html

Images (mentioned), Videos (mentioned), Text, Credits: NASA/Bill Keeter.

Best regards, Orbiter.ch

ROSCOSMOS: Soyuz-2.1А Launch Vehicle with KANOPUS-V-IK Satellite Successfully Lifts Off From Baikonur


ROSCOSMOS logo.

July 14, 2017

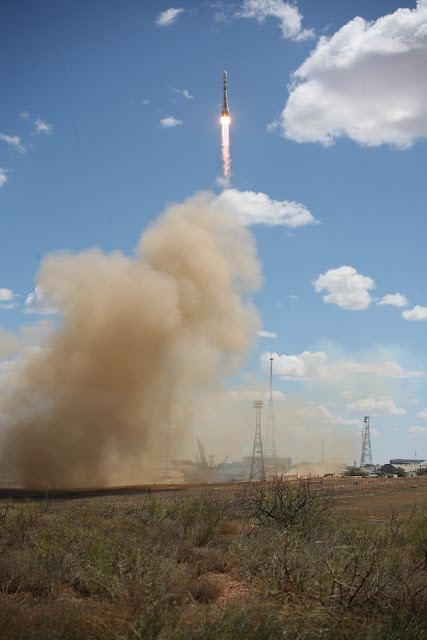
Soyuz-2.1a LV with Kanopus-V-IK launch

On July14, 2017 at 09:36 Moscow time, Soyuz-2.1a lifted off from Site 31 at the Baikonur Cosmodrome. The launch mission is to deliver an Earth observation Kanopus-V-IK satellite and 72 smallsats piggybacked under the federal and commercial contracts of Glavkosmos to their target orbits.

Soyuz-2.1a LV with Kanopus-V-IK launch

The spacecraft launched under the Russian federal contracts are as follows:

- MKA-N 1 6U-CubeSat (Russia, Dauria Aerospace in the order of Roscosmos);
- MKA-N 2 6U-CubeSat (Russia, Dauria Aerospace in the order of Roscosmos).

The spacecraft launched under Glavkosmos contracts are as follows:

CubeSats (illustration)

- Flying Laptop microsatellite (Germany);
- TechnoSat microsatellite (Germany);
- WNISAT-1R microsatellite (Japan);
- NorSat-1 microsatellite (Norway/Canada);
- NorSat-2 microsatellite (Norway/Canada);
- 48 Dove 3U-CubeSats as part of Flock-2k (USA);
- 3 CICERO 6U-CubeSats (USA);
- 2 Corvus-BC 6U-CubeSats (USA);
- 8 LEMUR 3U-CubeSats (USA);
- NanoACE 3U-CubeSat (USA);
- Mayak 3U-CubeSat (the Moscow Polytechnic University);
- Iskra-MAI-85 3U-CubeSat (the Moscow Aviation Institute);
- Ekvador UTE-YuZGU 1U-CubeSat (the South-Western State University).

72 smallsats make the mission setting a record in a number of spacecraft to be injected into several target orbits among smallsats launches ever.

Soyuz-2.1a LV with Kanopus-V-IK launch

The flight timeline is as follows:
    09:36:49 – launch vehicle lift-off;
    09:38:46 – 1st stage separation;
    09:41:36 – 2nd stage separation;
    09:41:38 – fairing jettison;
    09:45:37 – head module separation;
    09:45:42 – 09:52:18 – Fregat upper stage flight to a transfer orbit;
    10:35:01 – 10:36:27 – Fregat upper stage flight to the Kanopus-V-IK separation orbit;
    10:38:07 – Kanopus-V-IK separation (orbit i=97.44°; H = 522.5km; h = 478.6km);
    11:13:29 – 11:14:35 – Fregat upper stage flight to the second transfer orbit;
    11:58:29 – 11:59:35 – Fregat upper stage flight to the separation orbit of a group of smallsats;
    12:01:43 – 12:05:03 – Phase 1. Separation of 5 smallsats (orbits i=97.61°; H = 601.5-600.1km; h = 600.0-590.1km);
    12:10:03 – 12:26:43 – Phase 2. Separation of 19 smallsats (orbits i=97.62-97.61°; H = 601.0-606.9km; h = 580.1-587.4km);
    12:51:49 – 12:53:15 – Fregat upper stage flight to the third transfer orbit;
    13:34:39 – 13:35:51 – Fregat upper stage flight to the separation orbit of a group of smallsats;
    17:18:23 – 17:41:17 – Separation of 48 smallsats (orbits i=97.00-97.01°; H = 485.0-477.4km; h = 482.2-450.5km);
    17:51:49 – 17:53:45 – Fregat upper stage flight to reentry orbit;
    ~18:18:49 – Fregat upper stage reentry (altitude – 100km), sinking in the Indian Ocean.

Kanopus-V-IK satellite

Soyuz-2.1a Launch Vehicle

Soyuz-2 launcher is based on the Soyuz-U series. Soyuz-2 features advanced engines and up-to-date control and telemetry systems that significantly enhance the LV technical and operational specifications. The upgrading was done in two phases. At phase 1а, a standardized Soyuz-2.1a was born to accommodate various upper composites with fairings of up to 4.11m in diameter. The LV is capable to orbit a payload with improved accuracy; the upgraded control system and stage I-II engines have allowed for increasing of the payload mass to be lofted to the low Earth orbit. At phase 1b resulted in Soyuz-2.1b, stage III was refitted with a state-of-the-art 14D23 (RD-0124) engine which made its performance even better.

The prime LV designer is Progress Space Rocket Center (the city of Samara). Depending on a mission, Soyuz-2 launcher can be configured with the Fregat upper stage.

Soyuz-2 key features:

- a new generation of a legendary carrier rocket;
- environmentally-friendly fuel of kerosene and liquid oxygen;
- increased performance and a state-of-the-art control system providing new orbiting capabilities.

Fregat Upper Stage

A standard Fregat upper stage was designed by Lavochkin Association to complement various launchers in order to put satellites in different orbits. It is used in Soyuz rockets. A standard Fregat upper stage equipped with extra fuel tanks or drop-off tanks evolved to highly efficient upper stage modifications: Fregat-MT and Fregat-SB.

Fregat key features:

- independence – the upper stage orbits a payload without uplink control;
- the logic of upper stage operation provides for responding to potential anomalies;
- satellite navigation instruments in the control loop improve spacecraft insertion accuracy;
- lengthy active life (up to 2 days);
- operations at Baikonur, Plesetsk, the Guiana Space Center and, in the future, at Vostochny.

For more information, visit: http://en.roscosmos.ru/

Images, Video, Text, Credit: ROSCOSMOS/Günter Space Page.

Best regards, Orbiter.ch

jeudi 13 juillet 2017

New Science Gear Installed, Cargo Craft Packed for Disposal


ISS - Expedition 52 Mission patch.

July 13, 2017

Expedition 52 worked throughout Thursday installing new science gear to improve the research capabilities of the International Space Station. A cargo craft is also being loaded with trash and obsolete gear for disposal next week.

New network connections were installed on the main window of the Destiny lab module today. Flight Engineer Jack Fischer installed new equipment in the Window Observational Research Facility, or WORF, which hosts a variety of Earth sensing payloads to study the planet through a large window on the bottom of the Destiny Laboratory.


Image above: Flight Engineer Jack Fischer evaluates scientific hardware aboard the International Space Station. Image Credit: NASA.

Peggy Whitson of NASA installed a carbon dioxide controller inside an incubator. The incubator is part of the Space Automated Bioproduct Lab (SABL) located in Destiny. SABL enables space research that provides insights benefiting pharmaceutical, biotechnology and agricultural industries.

Commander Fyodor Yurchikhin is getting the Russian Progress 66 (66P) cargo craft ready to take out the trash next week. The 66P will undock July 20 from the Pirs docking compartment packed with old and discarded items and burn up harmlessly over the Pacific Ocean.

Related links:

Window Observational Research Facility (WORF): https://worf.msfc.nasa.gov/

Space Station Research and Technology: https://www.nasa.gov/mission_pages/station/research/index.html

International Space Station (ISS): https://www.nasa.gov/mission_pages/station/main/index.html

Image (mentioned), Text, Credits: NASA/Mark Garcia.

Best regards, Orbiter.ch

Mars and the Amazing Technicolor Ejecta Blanket & 'Elementary, My Dear Deposit...'


NASA - Mars Reconnaissance Orbiter (MRO) logo.

July 13, 2017

Mars and the Amazing Technicolor Ejecta Blanket

 
This image from NASA's Mars Reconnaissance Orbiter shows the exposed bedrock of an ejecta blanket of an unnamed crater in the Mare Serpentis region of Mars. Ejecta, when exposed, are truly an eye-opening feature, as they reveal the sometimes exotic subsurface, and materials created by impacts (close-up view). This ejecta shares similarities to others found elsewhere on Mars, which are of particular scientific interest for the extent of exposure and diverse colors. (For example, the Hargraves Crater ejecta, in the Nili Fossae trough region, was once considered as a candidate landing site for the next NASA Mars rover 2020.)

The colors observed in this picture represent different rocks and minerals, now exposed on the surface. Blue in HiRISE infrared color images generally depicts iron-rich minerals, like olivine and pyroxene. Lighter colors, such as yellow, indicate the presence of altered rocks.

The possible sources of the ejecta is most likely from two unnamed craters. How do we determine which crater deposited the ejecta?

A full-scale image shows numerous linear features that are observed trending in an east-west direction. These linear features indicate the flow direction of the ejecta from its unnamed host crater. Therefore, if we follow them, we find that they emanate from the bottom of the two unnamed craters. If the ejecta had originated from the top crater, then we would expect the linear features at the location of our picture to trend northwest to southeast.

The map is projected here at a scale of 50 centimeters (19.7 inches) per pixel. [The original image scale is 50.8 centimeters (20 inches) per pixel (with 2 x 2 binning); objects on the order of 153 centimeters (60.2 inches) across are resolved.] North is up.

'Elementary, My Dear Deposit...' 


In this image, NASA's Mars Reconnaissance Orbiter (MRO) observes an impact crater with associated bright deposits that at first glance give the appearance of seasonal frost or ice accumulations. MRO has an onboard spectrometer called CRISM that can distinguish between ices and other minerals. Unfortunately, there is currently no coverage of this particular spot. However, it can be deduced through several lines of evidence that this is, in fact, not ice.

Just like Earth, Mars experiences seasons that change as the planet orbits the Sun. Seasonal changes are most apparent at the higher latitudes. As these regions in each hemisphere enter their respective summer seasons, the Sun rises higher in the Martian sky causing frost and ice to sublimate, and illuminate more features across the landscape. As the high latitudes of each hemisphere move toward their respective winters, the days (called "sols") grow shorter and the sun hangs low on the horizon, giving rise to prolonged periods of cold, darkness, and frost accumulation.

First, it should be noted that at the time this image was taken, the Southern hemisphere is at the end of the summer season, so any frost or ice deposits have long since sublimated away. Second, numerous HiRISE images of seasonal targets show that ice accumulates on pole-facing slopes. The deposits in question are situated on a slope that faces the equator, and would not accumulate deposits of frost. Thus, it can be concluded that these exposures are light-toned mineral deposits.

The map is projected here at a scale of 25 centimeters (9.8 inches) per pixel. [The original image scale is 25.5 centimeters (10 inches) per pixel (with 1 x 1 binning); objects on the order of 77 centimeters (30.3 inches) across are resolved.] North is up.

Mars Reconnaissance Orbiter (MRO)

The University of Arizona, Tucson, operates HiRISE, which was built by Ball Aerospace & Technologies Corp., Boulder, Colo. NASA's Jet Propulsion Laboratory, a division of Caltech in Pasadena, California, manages the Mars Reconnaissance Orbiter Project for NASA's Science Mission Directorate, Washington.

Mars Reconnaissance Orbiter (MRO): http://www.nasa.gov/mission_pages/MRO/main/index.html

Images, Text, Credits: NASA/Martin Perez/Tony Greicius/JPL-Caltech/Univ. of Arizona.

Greetings, Orbiter.ch

LISA Pathfinder: bake, rattle and roll


ESA - LISA Pathfinder Mission patch.

13 July 2017

The final days of the LISA Pathfinder mission are some of the busiest, as controllers make final tests and get ready to switch off the gravitational pioneer next Tuesday.

Following 16 months of scientific effort, LISA Pathfinder completed its main mission on 30 June, having demonstrated the technology needed to operate ESA’s future LISA space observatory to study gravitational waves – ripples in spacetime predicted by Albert Einstein in his General Theory of Relativity.

LISA Pathfinder operating in space

The LISA mission will comprise three spacecraft orbiting some 2.5 million km apart in a triangular formation, with their ‘test masses’ isolated from all external forces bar gravity and linked by laser beams.

With the required sensitivity fully proven by LISA Pathfinder, teams are now using the spacecraft’s last days to conduct a series of technical tests on components and devices, making full use of every remaining minute.

“These tests will give us a better grasp of the craft’s behaviour and provide valuable feedback to the manufacturers about the characteristics of their equipment, in both routine and unusual conditions,” says spacecraft operations manager Ian Harrison.

LISA Pathfinder flight controllers

“The gravitational wave detectors work by measuring the changing separation of two cubes that are in free-fall. Changes in the spacecraft’s state or any movement may interfere with the measurements, and we want to better understand these for the future mission.”

In addition to satellite movement, the delicate cubes on LISA Pathfinder can be influenced by variations in their environment, such as in temperature and magnetic interference.

Inside LISA Pathfinder, with narration

Working at ESA’s mission control centre in Darmstadt, Germany, the controllers have been conducting daily tests since the mission formally ended its normal phase on 30 June. These could not be performed before because meeting the science goals required a very stable and ‘quiet’ environment.

Engineers have commanded the craft to turn to assess thermal effects on its systems, particularly the micropropulsion system, from solar illumination.

Repeating thermal tests previously performed on the ground will help to improve procedures for the future LISA mission.

Other tests are analysing the effect of magnetic interference, from the operation of pressure regulation valves in the cold-gas thruster system, on the spacecraft’s magnetic momentum, external forces and test mass control.

The teams have also been pushing the micropropulsion system and test-mass electrostatic sensing and control systems to their limits.

Ian Harrison

Spacecraft performance data have been recorded since the time of launch in December 2015 up to these last experiments, to determine the rate of hardware degradation in the harsh environment of space.

Boosting European industry

Results from this test series will be available to European hardware manufacturers for incorporation into future designs.

“These tests will help to eliminate variables that might influence the science results from future ESA missions, such as Euclid and LISA, and help reduce risk in their development,” says flight director Andreas Rudolph.

“The tests could go wrong for many reasons and might cause loss of data, or adversely affect the spacecraft, so they were not considered during the main technology demonstration phase of the mission.

“This is a great opportunity to test hardware in flight, with no effect on the mission objectives or final activities.”

Ready for lights out

Ground teams are getting ready to ‘passivate’ LISA Pathfinder, eliminating radio transmissions from the spacecraft and switching off most of the units.

In April, the spacecraft used its thrusters over five days to nudge itself into a safe orbit around the Sun, minimising any probability that it will return to the vicinity of Earth or Moon in the next 100 years, in line with ESA's requirement for space debris mitigation.

LISA Pathfinder exploded view

The final command switching off the craft is planned for around 18:00 GMT on 18 July.

“Before LISA Pathfinder, gravitational wave astronomy from space was a theoretical possibility, with its future implementation hidden behind a thick, dark wall,” says ESA’s Paolo Ferri, head of mission operations.

“This mission has opened a ‘door’ in this wall. The road to achieving a future mission that will detect gravitational waves is still very long, but we can see it and we can now start planning our long journey to reach it.”

ESA’s LISA Pathfinder: http://sci.esa.int/lisa-pathfinder/

Images, Video, Text, Credits: ESA//J. Mai/ATG medialab.

Greetings, Orbiter.ch

Tributes to wetter times on Mars


ESA - Mars Express Mission patch.

13 July 2017

Libya Montes colour view

A dried-out river valley with numerous tributaries is seen in this recent view of the Red Planet captured by ESA’s Mars Express.

This section of the Libya Montes region, which sits on the equator at the boundary of the southern highlands and northern lowlands, was imaged on 21 February 2017 by the spacecraft’s high-resolution stereo camera.

The Libya Montes highlands mountains, one of the oldest regions on Mars, were uplifted during the formation of the 1200 km-wide Isidis impact basin some 3.9 billion years ago, seen at the north of the context map.

Libya Montes in context

The features seen across the broader region indicate both flowing rivers and standing bodies of water such as lakes or even seas that were present in the early history of Mars.

The prominent river channel that runs from south to north (left to right in the main colour image) is thought to have cut through the region around 3.6 billion years ago. It apparently originates from the impact crater in the south, breaching its crater wall and flowing towards the north, navigating the hummocky mountains of the local topography. 

Libya Montes topography

The valley is fed by numerous tributaries, pointing to extensive rainfall and surface runoff from higher to lower regions. Groundwater seepage is also thought to have played a contribution in shaping the valley. A similar channel snakes its way across the bottom right of the scene.

Perspective view of Libya Montes

The mineralogy in the Libya Montes region is very diverse, as revealed by orbiting spacecraft. Aqueously formed and chemically altered minerals testify to past hydrothermal activity that may be linked to the formation of the Isidis impact basin.  For example, the impact could have mobilised liquid water by melting subsurface ice that subsequently interacted with the ancient, volcanic mountain rocks.

Libya Montes in 3D

Numerous craters in various states of degradation pockmark the entire scene, testament to the region’s long history. Perhaps the most noticeable craters are the two situated side by side close to the centre of the scene, their breached crater walls connecting them and giving the appearance of a figure of eight shape.

Another interesting crater lies to the left, nestled into the side of a hummocky mountain. Inevitably, its rim collapsed onto the valley floor beneath. Further left again, and a small crater has imprinted into the larger, wider crater, punching through to deeper layers below.

Mars Express spacecraft

The rich diversity of geologic features in this region – and in this image alone – showcases the dynamic environment the planet has witnessed through time, evolving from a warmer wetter climate that enabled liquid water to flow freely across the surface, to the arid world that we see today.

Related links:

Mars Express: http://www.esa.int/Our_Activities/Space_Science/Mars_Express

Mars Express overview: http://www.esa.int/Our_Activities/Space_Science/Mars_Express_overview

Mars Express 10 year brochure: http://esamultimedia.esa.int/multimedia/publications/BR-312/

Mars Express in-depth: http://sci.esa.int/marsexpress

ESA Planetary Science archive (PSA): http://www.rssd.esa.int/PSA

Mars Webcam: http://blogs.esa.int/vmc

High Resolution Stereo Camera: http://berlinadmin.dlr.de/Missions/express/indexeng.shtml

HRSC data viewer: http://hrscview.fu-berlin.de/

Behind the lens: http://www.esa.int/Our_Activities/Space_Science/Mars_Express/Behind_the_lens

Frequently asked questions: http://www.esa.int/Our_Activities/Space_Science/Mars_Express/Frequently_asked_questions

Images, Animation, Text, Credits: ESA/DLR/FU Berlin, , CC BY-SA 3.0 IGO/NASA MGS MOLA Science Team.

Best regards, Orbiter.ch

NASA's Juno Spacecraft Spots Jupiter's Great Red Spot


NASA - JUNO Mission logo.

July 13, 2017

 Close-up of Jupiter's Great Red Spot

Image above: This enhanced-color image of Jupiter's Great Red Spot was created by citizen scientist Jason Major using data from the JunoCam imager on NASA's Juno spacecraft. Image Credits: NASA/JPL-Caltech/SwRI/MSSS/Jason Major.

Images of Jupiter's Great Red Spot reveal a tangle of dark, veinous clouds weaving their way through a massive crimson oval. The JunoCam imager aboard NASA's Juno mission snapped pics of the most iconic feature of the solar system's largest planetary inhabitant during its Monday (July 10) flyby. The images of the Great Red Spot were downlinked from the spacecraft's memory on Tuesday and placed on the mission's JunoCam website Wednesday morning.

"For hundreds of years scientists have been observing, wondering and theorizing about Jupiter's Great Red Spot," said Scott Bolton, Juno principal investigator from the Southwest Research Institute in San Antonio. "Now we have the best pictures ever of this iconic storm. It will take us some time to analyze all the data from not only JunoCam, but Juno's eight science instruments, to shed some new light on the past, present and future of the Great Red Spot."

As planned by the Juno team, citizen scientists took the raw images of the flyby from the JunoCam site and processed them, providing a higher level of detail than available in their raw form. The citizen-scientist images, as well as the raw images they used for image processing, can be found at:

https://www.missionjuno.swri.edu/junocam/processing

"I have been following the Juno mission since it launched," said Jason Major, a JunoCam citizen scientist and a graphic designer from Warwick, Rhode Island. "It is always exciting to see these new raw images of Jupiter as they arrive. But it is even more thrilling to take the raw images and turn them into something that people can appreciate. That is what I live for."

Jupiter's Great Red Spot Revealed

Image above: This enhanced-color image of Jupiter's Great Red Spot was created by citizen scientist Kevin Gill using data from the JunoCam imager on NASA's Juno spacecraft. Image Credits: NASA/JPL-Caltech/SwRI/MSSS/Kevin Gill.

Measuring in at 10,159 miles (16,350 kilometers) in width (as of April 3, 2017) Jupiter's Great Red Spot is 1.3 times as wide as Earth. The storm has been monitored since 1830 and has possibly existed for more than 350 years. In modern times, the Great Red Spot has appeared to be shrinking.

All of Juno's science instruments and the spacecraft's JunoCam were operating during the flyby, collecting data that are now being returned to Earth. Juno's next close flyby of Jupiter will occur on Sept. 1.

Juno reached perijove (the point at which an orbit comes closest to Jupiter's center) on July 10 at 6:55 p.m. PDT (9:55 p.m. EDT). At the time of perijove, Juno was about 2,200 miles (3,500 kilometers) above the planet's cloud tops. Eleven minutes and 33 seconds later, Juno had covered another 24,713 miles (39,771 kilometers), and was passing directly above the coiling, crimson cloud tops of the Great Red Spot. The spacecraft passed about 5,600 miles (9,000 kilometers) above the clouds of this iconic feature.

Juno launched on Aug. 5, 2011, from Cape Canaveral, Florida. During its mission of exploration, Juno soars low over the planet's cloud tops -- as close as about 2,100 miles (3,400 kilometers). During these flybys, Juno is probing beneath the obscuring cloud cover of Jupiter and studying its auroras to learn more about the planet's origins, structure, atmosphere and magnetosphere.

Jupiter's Great Red Spot (Enhanced Color)

Image above: This enhanced-color image of Jupiter's Great Red Spot was created by citizen scientist Gerald Eichstädt using data from the JunoCam imager on NASA's Juno spacecraft. Image Credits: NASA/JPL-Caltech/SwRI/MSSS/Gerald Eichstadt.

Early science results from NASA's Juno mission portray the largest planet in our solar system as a turbulent world, with an intriguingly complex interior structure, energetic polar aurora, and huge polar cyclones.

"These highly-anticipated images of Jupiter's Great Red Spot are the 'perfect storm' of art and science. With data from Voyager, Galileo, New Horizons, Hubble and now Juno, we have a better understanding of the composition and evolution of this iconic feature," said Jim Green, NASA's director of planetary science. "We are pleased to share the beauty and excitement of space science with everyone." 

 JUNO spacecraft orbiting Jupiter. Animation Credit: NASA

JPL manages the Juno mission for the principal investigator, Scott Bolton, of Southwest Research Institute in San Antonio. The Juno mission is part of the New Frontiers Program managed by NASA's Marshall Space Flight Center in Huntsville, Alabama, for the Science Mission Directorate. Lockheed Martin Space Systems, Denver, built the spacecraft. JPL is a division of Caltech in Pasadena. More information on the Juno mission is available at:

https://www.nasa.gov/juno

http://missionjuno.org

The public can follow the mission on Facebook and Twitter at:

https://www.facebook.com/NASAJuno

https://www.twitter.com/NASAJuno

More information on the Great Red Spot can be found at:

https://www.nasa.gov/feature/goddard/jupiter-s-great-red-spot-a-swirling-mystery

https://www.nasa.gov/feature/jupiter-s-great-red-spot-likely-a-massive-heat-source

More information on Jupiter can be found at:

https://www.nasa.gov/jupiter

Images (mentioned), Animation (mentioned), Text, Credits: NASA/Dwayne Brown/Laurie Cantillo/JPL/DC Agle.

Best regards, Orbiter.ch

mercredi 12 juillet 2017

Crew Researches Exercise, Protein Crystals and High Temps


ISS - Expedition 52 Mission patch.

July 12, 2017

International Space Station (ISS). Animation Credit: NASA

A pair of astronauts explored new space exercise techniques today to stay healthy and fit on long duration missions. The crew also observed protein crystals and high temperatures to understand microgravity’s effects on humans and physical processes.

Expedition 52 Flight Engineer Jack Fischer strapped himself in to the space station’s exercise bike this morning with assistance from veteran astronaut Peggy Whitson. The work out study is researching the effectiveness of high intensity, low volume exercise to minimize loss of muscle, bone, and cardiovascular function in space.


Image above: This long-exposure photograph of Earth and starry sky was taken during a night pass by the Expedition 52 crew aboard the International Space Station. The Japanese Kibo module and part of the station’s solar array are visible at the top. Image Credit: NASA.

Whitson, who has been living in space since November 2016, then moved on and set up gear for the Two Phase Flow experiment. That study is observing how heat transfers from liquids in microgravity to help improve the design of thermal management systems in future space platforms.

Fischer later checked out protein crystals through a microscope for an experiment researching radiation damage, bone loss and muscle atrophy caused by living in space. At the end of the day, he swapped out samples that were heated up inside the Electrostatic Levitation Furnace. The furnace is a facility that allows safe observations and measurements of materials exposed to extremely high temperatures.

Related links:

High intensity, low volume exercise: https://www.nasa.gov/mission_pages/station/research/experiments/655.html

Two Phase Flow experiment: https://www.nasa.gov/mission_pages/station/research/experiments/1083.html

Protein crystals: https://www.nasa.gov/mission_pages/station/research/experiments/1970.html

Electrostatic Levitation Furnace: https://www.nasa.gov/sites/default/files/atoms/files/np-2017-04-014-jsc_iss_utilization_brochure_2017_physical_science.pdf

Space Station Research and Technology: https://www.nasa.gov/mission_pages/station/research/index.html

International Space Station (ISS): https://www.nasa.gov/mission_pages/station/main/index.html

Image (mentioned), Animation (mentioned), Text, Credits: NASA/Catherine Williams.

Best regards, Orbiter.ch

NASA's SDO Watches a Sunspot Turn Toward Earth


NASA - Solar Dynamics Observatory (SDO) patch.

July 12, 2017

NASA’s SDO Watches a Sunspot Turn Toward Earth

Video Credits: NASA’s Goddard Space Flight Center/SDO/Joy Ng, producer.

An active region on the sun — an area of intense and complex magnetic fields — has rotated into view on the sun and seems to be growing rather quickly in this video captured by NASA’s Solar Dynamics Observatory between July 5-11, 2017. Such sunspots are a common occurrence on the sun, but are less frequent as we head toward solar minimum, which is the period of low solar activity during its regular approximately 11-year cycle. This sunspot is the first to appear after the sun was spotless for two days, and it is the only sunspot group at this moment.


Animation above: SDO Watches a Sunspot Turn Toward Earth. Animation Credits: NASA’s Goddard Space Flight Center/SDO.

Like freckles on the face of the sun, they appear to be small features, but size is relative: The dark core of this sunspot is actually larger than Earth.

Solar Dynamics Observatory (SDO). Animation Credit: NASA

NASA’s Solar Dynamics Observatory (SDO): http://www.nasa.gov/mission_pages/sdo/main/index.html

Animations (mentioned), Video (mentioned), Text, Credits: NASA/Rob Garner/Goddard Space Flight Center, by Lina Tran.

Greetings, Orbiter.ch

Chandra Peers into a Nurturing Cloud


NASA - Chandra X-ray Observatory patch.

July 12, 2017


In the context of space, the term ‘cloud’ can mean something rather different from the fluffy white collections of water in the sky or a way to store data or process information. Giant molecular clouds are vast cosmic objects, composed primarily of hydrogen molecules and helium atoms, where new stars and planets are born. These clouds can contain more mass than a million suns, and stretch across hundreds of light years.

The giant molecular cloud known as W51 is one of the closest to Earth at a distance of about 17,000 light years. Because of its relative proximity, W51 provides astronomers with an excellent opportunity to study how stars are forming in our Milky Way galaxy.

A new composite image of W51 shows the high-energy output from this stellar nursery, where X-rays from Chandra are colored blue. In about 20 hours of Chandra exposure time, over 600 young stars were detected as point-like X-ray sources, and diffuse X-ray emission from interstellar gas with a temperature of a million degrees or more was also observed. Infrared light observed with NASA’s Spitzer Space Telescope appears orange and yellow-green and shows cool gas and stars surrounded by disks of cool material.

W51 contains multiple clusters of young stars. The Chandra data show that the X-ray sources in the field are found in small clumps, with a clear concentration of more than 100 sources in the central cluster, called G49.5−0.4 (pan over the image to find this source.)

Although the W51 giant molecular cloud fills the entire field-of-view of this image, there are large areas where Chandra does not detect any diffuse, low energy X-rays from hot interstellar gas. Presumably dense regions of cooler material have displaced this hot gas or blocked X-rays from it.

One of the massive stars in W51 is a bright X-ray source that is surrounded by a concentration of much fainter X-ray sources, as shown in a close-up view of the Chandra image. This suggests that massive stars can form nearly in isolation, with just a few lower mass stars rather than the full set of hundreds that are expected in typical star clusters.

Chandra X-ray Observatory. Animation Credits: NASA/CXC

Another young, massive cluster located near the center of W51 hosts a star system that produces an extraordinarily large fraction of the highest energy X-rays detected by Chandra from W51. Theories for X-ray emission from massive single stars can't explain this mystery, so it likely requires the close interaction of two very young, massive stars.  Such intense, energetic radiation must change the chemistry of the molecules surrounding the star system, presenting a hostile environment for planet formation.

A paper describing these results, led by Leisa Townsley (Penn State), appeared in the July 14th 2014 issue of The Astrophysical Journal Supplement Series and is available online: https://arxiv.org/abs/1403.2576

NASA’s Marshall Space Flight Center in Huntsville, Alabama, manages the Chandra program for NASA’s Science Mission Directorate in Washington. The Smithsonian Astrophysical Observatory in Cambridge, Massachusetts, controls Chandra’s science and flight operations.

Image Credit: X-ray: NASA/CXC/PSU/L. Townsley et al; Infrared: NASA/JPL-Caltech

Read More from NASA's Chandra X-ray Observatory: http://chandra.harvard.edu/photo/2017/w51/

For more Chandra images, multimedia and related materials, visit: http://www.nasa.gov/chandra

Image (mentioned), Animation (mentioned), Text, Credits: NASA/Lee Mohon.

Greetings, Orbiter.ch

Sentinel satellite captures birth of behemoth iceberg


ESA - Sentinel-1 Mission logo.

12 July 2017

Over the last few months, a chunk of Antarctica’s Larsen C ice shelf has been hanging on precariously as a deep crack cut across the ice. Witnessed by the Copernicus Sentinel-1mission, a lump of ice more than twice the size of Luxembourg has now broken off, spawning one of the largest icebergs on record and changing the outline of the Antarctic Peninsula forever.

The fissure first appeared several years ago, but seemed relatively stable until January 2016, when it began to lengthen.

Larsen C breaks

In January 2017 alone it travelled 20 km, reaching a total length of about 175 km.

After a few weeks of calm, the rift propagated a further 16 km at the end of May, and then extended further at the end of June.

More importantly, as the crack grew, it branched off towards the edge of the shelf, whereas before it had been running parallel to the Weddell Sea.

With just a few km between the end of the fissure and the ocean by early July, the fate of the shelf was sealed.

Scientists from Project MIDAS, an Antarctic research consortium led by Swansea University in the UK, used radar images from the Copernicus Sentinel-1 mission to keep a close eye on the rapidly changing situation.

Monitoring the rift

Since Antarctica is heading into the dark winter months, radar images are indispensable because, apart from the region being remote, radar continues to deliver images regardless of the dark and bad weather.

Adrian Luckman, leading MIDAS, said, “The recent development in satellite systems like Sentinel-1 has vastly improved our ability to monitor events such as this.”

Noel Gourmelen from the University of Edinburgh added. “We have been using information from ESA’s CryoSat mission, which carries a radar altimeter to measure the surface height and thickness of the ice, to reveal that the crack was several tens of metres deep.”

As predicted, a section of Larsen C – about 6000 sq km – finally broke away as part of the natural cycle of iceberg calving. The behemoth iceberg weighs more than a million million tonnes and contains about the same amount of water as Lake Ontario in North America.

Depth of ice crack

“We have been expecting this for months, but the rapidity of the final rift advance was still a bit of a surprise. We will continue to monitor both the impact of this calving event on the Larsen C ice shelf, and the fate of this huge iceberg,” added Prof. Luckman.

The iceberg’s progress is difficult to predict. It may remain in the area for decades, but if it breaks up, parts may drift north into warmer waters. Since the ice shelf is already floating, this giant iceberg does not influence sea level.

With the calving of the iceberg, about 10% of the area of the ice shelf has been removed.

The loss of such a large piece is of interest because ice shelves along the peninsula play an important role in ‘buttressing’ glaciers that feed ice seaward, effectively slowing their flow.

Previous events further north on the Larsen A and B shelves, captured by ESA’s ERS and Envisat satellites, indicate that when a large portion of an ice shelf is lost, the flow of glaciers behind can accelerate, contributing to sea-level rise.

Ice crack seen by Sentinel-2A

Thanks to Europe’s Copernicus environmental monitoring programme, we have the Sentinel satellites to deliver essential information about what’s happening to our planet. This is especially important for monitoring remote inaccessible regions like the poles.

ESA’s Mark Drinkwater said, “Having the Copernicus Sentinels in combination with research missions like CryoSat is essential for monitoring ice volume changes in response to climate warming.

“In particular, the combination of year-round data from these microwave-based satellite tools provides critical information with which to understand ice-shelf fracture mechanics and changes in dynamic integrity of Antarctic ice shelves.”

Related article:

Giant iceberg in the making
http://orbiterchspacenews.blogspot.ch/2017/07/giant-iceberg-in-making.html

Related links:

Sentinel-1: http://www.esa.int/Our_Activities/Observing_the_Earth/Copernicus/Sentinel-1

Sentinel-2: http://www.esa.int/Our_Activities/Observing_the_Earth/Copernicus/Sentinel-2

Sentinel data access & technical information: https://sentinels.copernicus.eu/web/sentinel/home

CryoSat: http://www.esa.int/Our_Activities/Observing_the_Earth/CryoSat

Access CryoSat data: https://earth.esa.int/web/guest/missions/esa-operational-eo-missions/cryosat

ESA's Climate Change Initiative (CCI): http://cci.esa.int/

Project MIDAS: http://www.projectmidas.org/

Swansea University–Dept. of Geography: http://www.swansea.ac.uk/geography/

Aberystwyth University–Glaciology: http://www.swansea.ac.uk/geography/

British Antarctic Survey: https://www.bas.ac.uk/

UK Natural Environment Research Council: http://www.nerc.ac.uk/

University of Edinburgh–School of Geosciences: http://www.ed.ac.uk/geosciences

Images, Animation, Text, Credits: ESA/contains modified Copernicus Sentinel data (2017), processed by ESA, Swansea University, CC BY-SA 3.0 IGO/University of Edinburgh.

Greetings, Orbiter.ch