samedi 12 janvier 2019

How to Watch the Only Total Lunar Eclipse of 2019, Plus a Supermoon


NASA logo.

January 12, 2019


Image above: The supermoon lunar eclipse captured as it moved over NASA’s Glenn Research Center on September 27, 2015. Image Credits: NASA/Rami Daud.

In the News

Looking up at the Moon can create a sense of awe at any time, but those who do so on the evening of January 20 will be treated to the only total lunar eclipse of 2019. Visible for its entirety in North and South America, this eclipse is being referred to by some as a super blood moon – “super” because the Moon will be closest to Earth in its orbit during the full moon (more on supermoons here) and “blood" because the total lunar eclipse will turn the Moon a reddish hue (more on that below). This is a great opportunity for students to observe the Moon – and for teachers to make connections to in-class science content.

How It Works

Eclipses can occur when the Sun, the Moon and Earth align. Lunar eclipses can happen only during a full moon, when the Moon and the Sun are on opposite sides of Earth. At that point, the Moon can move into the shadow cast by Earth, resulting in a lunar eclipse. However, most of the time, the Moon’s slightly tilted orbit brings it above or below Earth’s shadow.

Understanding Lunar Eclipses

The time period when the Moon, Earth and the Sun are lined up and on the same plane – allowing for the Moon to pass through Earth’s shadow – is called an eclipse season. Eclipse seasons last about 34 days and occur just shy of every six months. When a full moon occurs during an eclipse season, the Moon travels through Earth’s shadow, creating a lunar eclipse.


Image above: When a full moon occurs during an eclipse season, the Moon travels through Earth's shadow, creating a lunar eclipse. Image Credits: NASA/JPL-Caltech.

Unlike solar eclipses, which require special glasses to view and can be seen only for a few short minutes in a very limited area, a total lunar eclipse can be seen for about an hour by anyone on the nighttime side of Earth – as long as skies are clear.

The Moon passes through two distinct parts of Earth’s shadow during a lunar eclipse. The outer part of the cone-shaped shadow is called the penumbra. The penumbra is less dark than the inner part of the shadow because it’s penetrated by some sunlight. (You have probably noticed that some shadows on the ground are darker than others, depending on how much outside light enters the shadow; the same is true for the outer part of Earth’s shadow.) The inner part of the shadow, known as the umbra, is much darker because Earth blocks additional sunlight from entering the umbra.

At 0:36 GMT (6:36 p.m. PST 9:36 p.m. EST) on January 20, the edge of the Moon will begin entering the penumbra. The Moon will dim very slightly for the next 57 minutes as it moves deeper into the penumbra. Because this part of Earth’s shadow is not fully dark, you may notice only some dim shading (if anything at all) on the Moon near the end of this part of the eclipse.


Image above: During a total lunar eclipse, the Moon first enters into the penumbra, or the outer part of Earth's shadow, where the shadow is still penetrated by some sunlight. Image Credit: NASA.

At 1:33 GMT (7:33 p.m. PST 10:33 p.m. EST), the edge of the Moon will begin entering the umbra. As the Moon moves into the darker shadow, significant darkening of the Moon will be noticeable. Some say that during this part of the eclipse, the Moon looks as if it has had a bite taken out of it. That “bite” gets bigger and bigger as the Moon moves deeper into the shadow.


Image above: As the Moon starts to enter into the umbra, the inner and darker part of Earth's shadow, it appears as if a bite has been taken out of the Moon. This "bite" will grow until the Moon has entered fully into the umbra. Image Credit: NASA.

At 2:41 GMT (8:41 p.m. PST 11:41 p.m. EST), the Moon will be completely inside the umbra, marking the beginning of the total lunar eclipse. The moment of greatest eclipse, when the Moon is halfway through the umbra, occurs at 3:12 GMT (9:12 p.m. PST 12:12 a.m. EST).


Image above: The total lunar eclipse starts once the moon is completely inside the umbra. And the moment of greatest eclipse happens with the Moon is halfway through the umbra as shown in this graphic. Image Credit: NASA.

As the Moon moves completely into the umbra, something interesting happens: The Moon begins to turn reddish-orange. The reason for this phenomenon? Earth’s atmosphere. As sunlight passes through it, the small molecules that make up our atmosphere scatter blue light, which is why the sky appears blue. This leaves behind mostly red light that bends, or refracts, into Earth’s shadow. We can see the red light during an eclipse as it falls onto the Moon in Earth’s shadow. This same effect is what gives sunrises and sunsets a reddish-orange color.


Image above: As the Moon moves completely into the umbra, it turns a reddish-orange color. Image Credit: NASA.

A variety of factors affect the appearance of the Moon during a total lunar eclipse. Clouds, dust, ash, photochemical droplets and organic material in the atmosphere can change how much light is refracted into the umbra. Additionally, the January 2019 lunar eclipse takes place when the full moon is at or near the closest point in its orbit to Earth – a time popularly known as a supermoon. This means the Moon is deeper inside the umbra shadow and therefore may appear darker. The potential for variation provides a great opportunity for students to observe and classify the lunar eclipse based on its brightness. Details can be found in the “Teach It” section below.

At 3:43 GMT (9:43 p.m. PST 12:43 a.m. EST), the edge of the Moon will begin exiting the umbra and moving into the opposite side of the penumbra. This marks the end of the total lunar eclipse.

At 4:50 GMT (10:50 p.m. PST 1:50 a.m. EST), the Moon will be completely outside the umbra. It will continue moving out of the penumbra until the eclipse ends at 5:48 GMT (11:48 p.m 2:48 a.m. EST).

What if it’s cloudy where you live? Winter eclipses always bring with them the risk of poor viewing conditions. If your view of the Moon is obscured by the weather, explore options for watching the eclipse online, such as the Time and Date live stream: https://www.timeanddate.com/live/

Lunar eclipses have long played an important role in understanding Earth and its motions in space.

Total Lunar Eclipse. Animation Credits: NASA/JPL

In ancient Greece, Aristotle noted that the shadows on the Moon during lunar eclipses were round, regardless of where an observer saw them. He realized that only if Earth were a spheroid would its shadows be round – a revelation that he and others had many centuries before the first ships sailed around the world.

Earth wobbles on its axis like a spinning top that’s about to fall over, a phenomenon called precession. Earth completes one wobble, or precession cycle, over the course of 26,000 years. Greek astronomer Hipparchus made this discovery by comparing the position of stars relative to the Sun during a lunar eclipse to those recorded hundreds of years earlier. A lunar eclipse allowed him to see the stars and know exactly where the Sun was for comparison – directly opposite the Moon. If Earth didn’t wobble, the stars would appear to be in the same place they were hundreds of years earlier. When Hipparchus saw that the stars’ positions had indeed moved, he knew that Earth must wobble on its axis!

Lunar eclipses are also used for modern-day science investigations. Astronomers have used ancient eclipse records and compared them with computer simulations. These comparisons helped scientists determine the rate at which Earth’s rotation is slowing.

More on supermoons here: https://www.jpl.nasa.gov/edu/news/2017/11/15/whats-a-supermoon-and-just-how-super-is-it/

Images (mentioned), Animation (mentioned), Video, Text, Credits: NASA/Goddard/JPL/Lyle Tavernier.

Greetings, Orbiter.ch

vendredi 11 janvier 2019

Station, SpaceX Managers Set Dragon Release For Sunday Afternoon


ISS - Expedition 58 Mission patch.

January 11, 2019

To take advantage of calmer sea states in a different location in the Pacific Ocean, SpaceX and the International Space Station Program agreed to move the departure of the SpaceX-CRS-16 Dragon cargo craft from the station from early Sunday morning to late Sunday afternoon, setting up the first night splashdown and recovery of a Dragon vehicle.

Dragon’s hatch will be closed Sunday morning, and the spacecraft will be detached from the Harmony module around 3 p.m. EST Sunday.


Image above: The SpaceX Dragon cargo craft is pictured attached to the International Space Station’s Harmony module as the orbital complex flew 258 miles above the Indian Ocean off the eastern coast of South Africa. Image Credit: NASA.

Ground controllers will now release Dragon from the Canadarm2 robotic arm at 6:30 p.m. Sunday. NASA TV coverage of the operation without commentary will begin at 6:15 p.m. NASA Flight Engineer Anne McClain will monitor the release from the station’s cupola.

Dragon’s deorbit burn to begin its descent back to Earth is now scheduled at approximately 11:19 p.m. with splashdown scheduled at around 12:10 a.m. Monday (9:10 p.m. Pacific time) just west of Baja California.

Related links:

Expedition 58: https://www.nasa.gov/mission_pages/station/expeditions/expedition58/index.html

SpaceX Dragon: https://www.nasa.gov/mission_pages/station/structure/launch/spacex.html

Canadarm2 robotic arm: https://www.nasa.gov/mission_pages/station/structure/elements/mobile-servicing-system.html

Harmony module: https://www.nasa.gov/mission_pages/station/structure/elements/harmony

NASA TV: https://www.nasa.gov/nasatv

Space Station Research and Technology: https://www.nasa.gov/mission_pages/station/research/index.html

International Space Station (ISS): https://www.nasa.gov/mission_pages/station/main/index.html

Image (mentioned), Text, Credits: NASA/Mark Garcia.

Best regards, Orbiter.ch

SpaceX - IRIDIUM-8 Mission Success


SpaceX - Iridium NEXT VIII Mission patch.

Jan. 11, 2019

Falcon 9 carrying Iridium NEXT VIII lift off

On Friday, January 11 at 7:31 a.m. PST, 15:31 UTC, SpaceX successfully launched the eighth and final set of satellites in a series of 75 total satellites for Iridium’s next generation global satellite constellation, Iridium NEXT.

IRIDIUM-8 MISSION

Falcon 9’s first stage delivered the second stage to its targeted orbit followed by deployment of all 10 Iridium NEXT satellites approximately 1 hour and 12 minutes after launch.

Following stage separation, the first stage of Falcon 9 successfully landed on SpaceX's “Just Read the Instructions” droneship stationed in the Pacific Ocean. Falcon 9’s first stage for the Iridium-8 mission previously supported the Telstar 18 VANTAGE mission in September 2018.

A SpaceX Falcon 9 rocket launches 10 satellites (Iridium Next 66-75) for the Iridium next mobile communications fleet.

Iridium NEXT satellite

Iridium will use its new satellite network to provide improved communications services to more than a million customers across a variety of industries, including expanded services for the so-called “Internet of Things”—smart devices that need their own communications network to connect to the internet.

For more information about SpaceX, visit: https://www.spacex.com/

For more information about Iridium NEXT, visit: https://www.iridium.com/network/iridium-next/

Images, Video, Text, Credits: SpaceX/Iridium/Orbiter.ch Aerospace/Roland Berga.

Greetings, Orbiter.ch

Team of telescopes finds X-ray engine inside mysterious supernova


ESA - Integral Mission patch / ESA - XMM-Newton Mission patch.

11 January 2019

ESA’s high-energy space telescopes Integral and XMM-Newton have helped to find a source of powerful X-rays at the centre of an unprecedentedly bright and rapidly evolving stellar explosion that suddenly appeared in the sky earlier this year.

The ATLAS telescope in Hawaii first spotted the phenomenon, since then named AT2018cow, on 16 June. Soon after that, astronomers all over the world were pointing many space- and ground-based telescopes towards the newly found celestial object, located in a galaxy some 200 million light years away.

Supernova host galaxy

They soon realised this was something completely new. In only two days the object exceeded the brightness of any previously observed supernova – a powerful explosion of an aging massive star that expels most of its material into the surrounding space, sweeping up the interstellar dust and gases in its vicinity.

A new paper, accepted for publication in the Astrophysical Journal, presents the observations from the first 100 days of the object’s existence, covering the entire electromagnetic spectrum of the explosion from radio waves to gamma rays.

The analysis, which includes observations from ESA’s Integral and XMM-Newton, as well as NASA’s NuSTAR and Swift space telescopes, found a source of high-energy X-rays sitting deep inside the explosion.

The behaviour of this source, or engine, as revealed in the data, suggests that the strange phenomenon could either be a nascent black hole or neutron star with a powerful magnetic field, sucking in the surrounding material.

“The most exciting interpretation is that we might have seen for the first time the birth of a black hole or a neutron star,” says Raffaella Margutti of Northwestern University, USA, lead author of the paper.

“We know that black holes and neutron stars form when stars collapse and explode as a supernova, but never before have we seen one right at the time of birth,” adds co-author Indrek Vurm of Tartu Observatory, Estonia, who worked on modelling the observations.

Supernova on 17 August

The AT2018cow explosion was not only 10 to 100 times brighter than any other supernova previously observed: it also reached peak luminosity much faster than any other previously known event – in only a few days compared to the usual two weeks.

Integral made its first observations of the phenomenon about five days after it had been reported and kept monitoring it for 17 days. Its data proved crucial for the understanding of the strange object.

“Integral covers a wavelength range which is not covered by any other satellite,” says Erik Kuulkers, Integral project scientist at ESA. “We have a certain overlap with NuSTAR in the high-energy X-ray part of the spectrum but we can see higher energies, too.”

So while data from NuSTAR revealed the hard X-ray spectrum in great detail, with Integral the astronomers were able to see the spectrum of the source entirely, including its upper limit at soft gamma-ray energies.

“We saw a kind of a bump with a sharp cut-off in the spectrum at the high-energy end,” says Volodymyr Savchenko, an astronomer at the University of Geneva, Switzerland, who worked on the Integral data. “This bump is an additional component of the radiation released by this explosion, shining through an opaque, or optically thick, medium.”

“This high-energy radiation most likely came from an area of very hot and dense plasma surrounding the source,” adds Carlo Ferrigno, also of the University of Geneva.

Supernova evolution in X-rays

Because Integral kept monitoring the AT2018cow explosion over a longer period of time, its data was also able to show that the high-energy X-ray signal was gradually fading.

Raffaella explains that this high-energy X-ray radiation that went away was the so-called reprocessed radiation – radiation from the source interacting with material ejected by the explosion. As the material travels away from the centre of the explosion, the signal gradually wanes and eventually disappears completely.

In this signal, however, the astronomers were able to find patterns typical of an object that draws in matter from its surroundings – either a black hole or a neutron star.

ESA’s high-energy space telescopes Integral

“This is the most unusual thing that we have observed in AT2018cow and it’s definitely something unprecedented in the world of explosive transient astronomical events,” says Raffaella.

Meanwhile, XMM-Newton looked at this unusual explosion twice over the first 100 days of its existence. It detected the lower-energy part of its X-ray emission, which, according to the astronomers, comes directly from the engine at the core of the explosion. Unlike the high-energy X-rays coming from the surrounding plasma, the lower-energy X-rays from the source are still visible.

The astronomers plan to use XMM-Newton to perform a follow-up observation in the future, which will allow them to understand the source’s behaviour over a longer period of time in greater detail.

XMM-Newton X-ray Observatory

“We are continuing to analyse the XMM-Newton data to try to understand the nature of the source,” says co-author Giulia Migliori of University of Bologna, Italy, who worked on the X-ray data. “Accreting black holes leave characteristic imprints in X-rays, which we might be able to detect in our data.” 

“This event was completely unexpected and it shows that there is a lot of which we don’t completely understand,” says Norbert Schartel, ESA’s XMM-Newton project scientist. “One satellite, one instrument alone, would never be able to understand such a complex object. The detailed insights we were able to gather into the inner workings of the mysterious AT2018cow explosion were only achievable thanks to the broad cooperation and combination of many telescopes.”

Notes for editors:

“An embedded X-ray source shines through the aspherical AT2018cow: revealing the inner workings of the most luminous fast-evolving optical transients” by R. Margutti et al is accepted in Astrophysical Journal:
https://arxiv.org/abs/1810.10720

Related article:

Holy Cow! Mysterious Blast Studied with NASA Telescopes
https://orbiterchspacenews.blogspot.com/2019/01/holy-cow-mysterious-blast-studied-with.html

Related links:

ESA’s Integral: http://sci.esa.int/integral/

ESA’s XMM-Newton: http://sci.esa.int/xmm-newton/

Text, Credits:ESA/Markus Bauer/Norbert Schartel/Erik Kuulkers/INAF–Institute of Radioastronomy, University of Bologna/Giulia Migliori/Department of Astronomy, University of Geneva/Carlo Ferrigno/Volodymyr Savchenko/University of Tartu/Indrek Vurm/Department of Physics and Astronomy, Northwestern University/Raffaella Margutti/Images: W. M. Keck Observatory/R. Margutti/Animation: Courtesy of R. Margutti et al. (2019).

Best regards, Orbiter.ch

Unpublished 360° picture of the hidden side of the Moon


CLEP - China Lunar Exploration Program logo.

Jan. 11, 2019

360° picture of the hidden side of the Moon

The Chinese lunar probe sent an impressive panoramic photo of its arrival location, showing a gray landscape dotted with craters.

Sequence of landing pictures by Chang'e-4 onboard camera. Image Credits:CNSA/CLEP

The Chang'e-4 mission succeeded, on January 3rd, the first smooth landing of the history on this hemisphere of the Moon which turns permanently back to the Earth. This is a crucial step in China's ambitious space program. A small wheeled remote-controlled robot Yutu-2 ("Jade Bunny 2") has left the lander and is moving on the lunar surface to perform analyzes.

Chang'e-4 landing (Onboard Camera View)

A camera, installed on the probe Chang'e-4, took a picture released Friday by China National Space Agency CNSA (China National Space Administration).


Image above: The 360-degree panoramic image shows a gray lunar surface, part of the probe and the little robot with the marks left by its wheels. "The researchers completed the preliminary analysis of the lunar surface topography around the moon landing site based on the image taken by the camera," said the CNSA. Image Credits: CLEP/CNSA.

Extremely hot temperatures

The Chang'e-4 probe, the Jade Bunny 2, and the Queqiao satellite responsible for returning the information to Earth "are in a stable state and all programs are proceeding as planned," the statement said.

Chang'e 4 lander-rover relayed back via satellite relay.Image Credits: CASC/CNSA

The small 140 kg remote-controlled robot resumed its activity on Thursday after being put on standby for several days to avoid the extremely hot temperatures that prevailed on the lunar surface.

This is the second time China has sent a machine to explore the moon after the first Yutu rover in 2013.

Related article:

China's Yutu-2 rover Enters Standby Mode for 'Noon Nap' as Chang'e 4 Tests Continue
https://orbiterchspacenews.blogspot.com/2019/01/chinas-yutu-2-rover-enters-standby-mode.html

For more information about China Aerospace Science and Technology Corporation (CASC), visit: http://english.spacechina.com/n16421/index.html

For more information about China National Space Administration (CNSA), visit: http://www.cnsa.gov.cn/

Images (mentioned), Video, Text, Credits: CNSA/CLEP/AFP/SciNews/Orbiter.ch Aerospace/Roland Berga.

Greetings, Orbiter.ch

jeudi 10 janvier 2019

Holy Cow! Mysterious Blast Studied with NASA Telescopes


NASA - NuSTAR Mission patch.

Jan. 10, 2019


Image above: AT2018cow erupted in or near a galaxy known as CGCG 137-068, which is located about 200 million light-years away in the constellation Hercules. This zoomed-in image shows the location of the "Cow" in the galaxy. Image Credit: Sloan Digital Sky Survey.

A brief and unusual flash spotted in the night sky on June 16, 2018, puzzled astronomers and astrophysicists across the globe. The event — called AT2018cow and nicknamed "the Cow" after the coincidental final letters in its official name — is unlike any celestial outburst ever seen before, prompting multiple theories about its source.

Over three days, the Cow produced a sudden explosion of light at least 10 times brighter than a typical supernova, and then it faded over the next few months. This unusual event occurred inside or near a star-forming galaxy known as CGCG 137-068, located about 200 million light-years away in the constellation Hercules. The Cow was first observed by the NASA-funded Asteroid Terrestrial-impact Last Alert System telescope in Hawaii.

So exactly what is the Cow? Using data from multiple NASA missions, including the Neil Gehrels Swift Observatory and the Nuclear Spectroscopic Telescope Array (NuSTAR), two groups are publishing papers that provide possible explanations for the Cow's origins. One paper argues that the Cow is a monster black hole shredding a passing star. The second paper hypothesizes that it is a supernova — a stellar explosion — that gave birth to a black hole or a neutron star.

Researchers from both teams shared their interpretations at a panel discussion on Thursday, Jan. 10, at the 233rd American Astronomical Society meeting in Seattle.

The 'Cow' Explosion: Black Hole Eats White Dwarf

Video above: Watch what scientists think happens when a black hole tears apart a hot, dense white dwarf star. A team working with observations from NASA's Neil Gehrels Swift Observatory suggests this process explains a mysterious outburst known as AT2018cow, or "the Cow." Video Credits: NASA's Goddard Space Flight Center.

A Black Hole Shredding a Compact Star?

One potential explanation of the Cow is that a star has been ripped apart in what astronomers call a "tidal disruption event." Just as the Moon's gravity causes Earth's oceans to bulge, creating tides, a black hole has a similar but more powerful effect on an approaching star, ultimately breaking it apart into a stream of gas. The tail of the gas stream is flung out of the system, but the leading edge swings back around the black hole, collides with itself and creates an elliptical cloud of material. According to one research team using data spanning from infrared radiation to gamma rays from Swift and other observatories, this transformation best explains the Cow's behavior.


Image above: AT2018cow erupted in or near a galaxy known as CGCG 137-068, which is located about 200 million light-years away from Earth in the constellation Hercules. The yellow cross shows the location of this puzzling outburst. Image Credit: Sloan Digital Sky Survey.

"We've never seen anything exactly like the Cow, which is very exciting," said Amy Lien, an assistant research scientist at the University of Maryland, Baltimore County and NASA's Goddard Space Flight Center in Greenbelt, Maryland. "We think a tidal disruption created the quick, really unusual burst of light at the beginning of the event and best explains Swift's multiwavelength observations as it faded over the next few months."

Lien and her colleagues think the shredded star was a white dwarf — a hot, roughly Earth-sized stellar remnant marking the final state of stars like our Sun. They also calculated that the black hole's mass ranges from 100,000 to 1 million times the Sun's, almost as large as the central black hole of its host galaxy. It's unusual to see black holes of this scale outside the center of a galaxy, but it's possible the Cow occurred in a nearby satellite galaxy or a globular star cluster whose older stellar populations could have a higher proportion of white dwarfs than average galaxies.

A paper describing the findings, co-authored by Lien, will appear in a future edition of the journal Monthly Notices of the Royal Astronomical Society.

"The Cow produced a large cloud of debris in a very short time," said lead author Paul Kuin, an astrophysicist at University College London (UCL). "Shredding a bigger star to produce a cloud like this would take a bigger black hole, result in a slower brightness increase and take longer for the debris to be consumed."

Or a New View of a Supernova?

A different team of scientists was able to gather data on the Cow over an even broader range of wavelengths, spanning from radio waves to gamma rays. Based on those observations, the team suggests that a supernova could be the source of the Cow. When a massive star dies, it explodes as a supernova and leaves behind either a black hole or an incredibly dense object called a neutron star. The Cow could represent the birth of one of these stellar remnants.
cosmic event nicknamed "the Cow,"


Image above: Astronomers using ground-based observatories caught the progression of a cosmic event nicknamed "the Cow," as seen in these three images. Left: The Sloan Digital Sky Survey in New Mexico observed the host galaxy Z 137-068 in 2003, with the Cow nowhere in sight. (The green circle indicates the location where the Cow eventually appeared). Center: The Liverpool Telescope in Spain’s Canary Islands saw the Cow very close to the event’s peak brightness on June 20, 2018, when it was much brighter than the host galaxy. Right: The William Herschel Telescope, also in the Canary Islands, took a high-resolution image of the Cow nearly a month after it reached peak brightness, as it faded and the host galaxy came back into view. Image Credits: Daniel Perley, Liverpool John Moores University.

"We saw features in the Cow that we have never seen before in a transient, or rapidly changing, object," said Raffaella Margutti, an astrophysicist at Northwestern University in Evanston, Illinois, and lead author of a study about the Cow to be published in The Astrophysical Journal. "Our team used high-energy X-ray data to show that the Cow has characteristics similar to a compact body like a black hole or neutron star consuming material. But based on what we saw in other wavelengths, we think this was a special case and that we may have observed — for the first time — the creation of a compact body in real time."

Margutti's team analyzed data from multiple observatories, including NASA's NuSTAR, ESA's (the European Space Agency's) XMM-Newton and INTEGRAL satellites, and the National Science Foundation's Very Large Array. The team proposes that the bright optical and ultraviolet flash from the Cow signaled a supernova and that the X-ray emissions that followed shortly after the outburst arose from gas radiating energy as it fell onto a compact object.

Typically, a supernova's expanding debris cloud blocks any light from the compact object at the center of the blast. Because of the X-ray emissions, Margutti and her colleagues suggest the original star in this scenario may have been relatively low in mass, producing a comparatively thinner debris cloud through which X-rays from the central source could escape.

Nuclear Spectroscopic Telescope Array or NuSTAR. Image Credits: NASA/JPL

"If we're seeing the birth of a compact object in real time, this could be the start of a new chapter in our understanding of stellar evolution," said Brian Grefenstette, a NuSTAR instrument scientist at Caltech and a co-author of Margutti's paper. "We looked at this object with many different observatories, and of course the more windows you open onto an object, the more you can learn about it. But, as we're seeing with the Cow, that doesn't necessarily mean the solution will be simple."

NuSTAR is a Small Explorer mission led by Caltech and managed by JPL for NASA's Science Mission Directorate in Washington. NuSTAR was developed in partnership with the Danish Technical University and the Italian Space Agency (ASI). The spacecraft was built by Orbital Sciences Corporation in Dulles, Virginia. NuSTAR's mission operations center is at UC Berkeley, and the official data archive is at NASA's High Energy Astrophysics Science Archive Research Center. ASI provides the mission's ground station and a mirror archive. JPL is managed by Caltech for NASA.

NASA's Goddard Space Flight Center manages the Swift mission in collaboration with Penn State in University Park, the Los Alamos National Laboratory in New Mexico and Northrop Grumman Innovation Systems in Dulles, Virginia. Other partners include the University of Leicester and Mullard Space Science Laboratory of the University College London in the United Kingdom, Brera Observatory and ASI.

NuSTAR (Nuclear Spectroscopic Telescope Array): http://www.nasa.gov/mission_pages/nustar/main/index.html

Related links:

ESA's XMM-Newton: http://sci.esa.int/xmm-newton/

The Astrophysical Journal: https://arxiv.org/abs/1810.10720

Royal Astronomical Society: https://arxiv.org/abs/1808.08492

University of Maryland: https://www.umbc.edu/

University College London (UCL): https://www.ucl.ac.uk/

NASA's Goddard Space Flight Center (GSFC): https://www.nasa.gov/goddard

Images (mentioned), Video (mentioned), Text, Credits: NASA/Tony Greicius/JPL/Calla Cofield/Goddard Space Flight Center, by Jeanette Kazmierczak.

Greetings, Orbiter.ch

CASC - Long March-3B launches ChinaSat-2D (Zhongxing-2D)


CASC - China Aerospace Science and Technology Corporation logo.

Jan. 10, 2019

Long March-3B rocket carrying ChinaSat-2D launch

A Long March-3B rocket launched the ChinaSat-2D satellite from the Xichang Satellite Launch Center, Sichuan Province, southwest China, on 10 January 2019, at 17:11 UTC (11 January at 01:11 local time).

Long March-3B launches ChinaSat-2D (Zhongxing-2D)

ChinaSat-2D or Zhongxing-2D (中星2D) is a communications satellite operated by China Satellite Communications.

China uses two types of satellites for secure military communications: the Fenghuo and the Shentong. The Fenghuo series is used for tactical military communications, providing secured digital data and voice communication to Chinese military forces. The Chinese are currently operating the DFH-4 based Fenghuo-2 second-generation satellite, with the first of the series – the Zhongxing-1A (37804 2011-047A) – launched at 13:33 UTC on September 18th, 2011, by the Chang Zheng-3B (Y16) rocket.


The Shentong geostationary military communication satellites are operated by the Army and their aim is to provide secure voice and data communications services for ground users using Ku-band. The first generation Shentong satellites were based on the DFH-3 (Dongfanghong-3) satellite platform that was developed by the China Academy of Space Technology (CAST), having a heavier payload with better reliability and increased power supply.

For more information about China Aerospace Science and Technology Corporation (CASC): http://english.spacechina.com/n16421/index.html

Images, Video, Text, Credits: CASC/CCTV/GCBARRETT.com/SciNews/Orbiter.ch Aerospace/Roland Berga.

Greetings, Orbiter.ch

Dragon’s Return to Earth Delayed, Crew Moves on to Research


ISS - Expedition 58 Mission patch.

January 10, 2019

The SpaceX Dragon cargo craft had its stay extended at the International Space Station a few more days. Mission managers observed inclement weather at Dragon’s splashdown site in the Pacific Ocean and decided against Dragon’s return to Earth today.

Meanwhile, Dragon’s hatch remains open and the Expedition 58 crew is tending to time-sensitive experiments targeted for return and analysis back on Earth. The Canadarm2 robotic arm has the Dragon firmly in its grips while the cargo vehicle is still attached to the Harmony module.


Image above: The SpaceX Dragon cargo craft is pictured attached to the International Space Station’s Harmony module as the orbital complex flew 256 miles above Alaska’s Aleutian Islands in the Bering Sea. Image Credits: NASA.

Robotics controllers will command the Canadarm2 to uninstall Dragon from Harmony on Saturday afternoon then slowly maneuver the U.S. space freighter to its release position. The Canadarm2 will then be commanded to release Dragon Sunday at 3:36 a.m. EST as astronaut Anne McClain monitors from the cupola. NASA TV will broadcast the departure live without commentary starting Sunday at 3:15 a.m.

Today, the three space station residents are back on science and maintenance duties with Dragon poised for a weekend departure. McClain of NASA is checking out and preserving the space research meant for return inside Dragon.

Flight Engineer David Saint-Jacques of the Canadian Space Agency assisted McClain first thing Thursday morning. He then moved on to the Vascular Echo study scanning his leg’s femoral artery with an ultrasound device to understand how living in space affects the cardiovascular system.


Image above: Sunrise over North Pacific Ocean, seen by EarthCam on ISS, speed: 27'610 Km/h, altitude: 408,32 Km, image captured by Roland Berga (on Earth in Switzerland) from International Space Station (ISS) using ISS-HD Live application with EarthCam's from ISS on January 10, 2019 at 19:42 UTC. Image Credits: Orbiter.ch Aerospace/Roland Berga.

Cosmonaut Oleg Kononenko explored ways to improve piloting techniques in space and participated in a psychological assessment. The four-time station resident also maintained Russian life support systems aboard the orbital lab.

Back on Earth, NASA and SpaceX are continuing to work on the activities leading toward the Demo-1, uncrewed flight test to the International Space Station. NASA and SpaceX are now targeting no earlier than February for the launch of Demo-1 to complete hardware testing and joint reviews. NASA and SpaceX will confirm a new target date after coordination with the Eastern Range and the International Space Station Program.

Related links:

Expedition 58: https://www.nasa.gov/mission_pages/station/expeditions/expedition58/index.html

SpaceX Dragon: https://www.nasa.gov/mission_pages/station/structure/launch/spacex.html

Canadarm2 robotic arm: https://www.nasa.gov/mission_pages/station/structure/elements/mobile-servicing-system.html

Harmony module: https://www.nasa.gov/mission_pages/station/structure/elements/harmony

NASA TV: https://www.nasa.gov/nasatv

Vascular Echo: https://www.nasa.gov/mission_pages/station/research/experiments/explorer/Investigation.html?#id=1664

Piloting techniques: https://www.energia.ru/en/iss/researches/human/24.html

Psychological assessment: https://www.energia.ru/en/iss/researches/human/20.htmlvv

Canadian Space Agency (ASC-CSA): http://www.asc-csa.gc.ca/eng/default.asp

National Aeronautics and Space Administration (NASA): https://www.nasa.gov/

Space Station Research and Technology: https://www.nasa.gov/mission_pages/station/research/index.html

International Space Station (ISS): https://www.nasa.gov/mission_pages/station/main/index.html

Images (mentioned), Text, Credits: NASA/Mark Garcia/Orbiter.ch Aerospace/Roland Berga.

Best regards, Orbiter.ch

Giant pattern discovered in the clouds of planet Venus


JAXA - Planet-C Mission patch.

January 10, 2019

Giant pattern discovered in the clouds of planet Venus Infrared cameras and supercomputer simulations break through Venus' veil

A Japanese research group has identified a giant streak structure among the clouds covering planet Venus based on observation from the spacecraft Akatsuki. The team also revealed the origins of this structure using large-scale climate simulations. The group was led by Project Assistant Professor Hiroki Kashimura (Kobe University, Graduate School of Science) and these findings were published on January 9 in Nature Communications.

Venus is often called Earth’s twin because of their similar size and gravity, but the climate on Venus is very different. Venus rotates in the opposite direction to Earth, and a lot more slowly (about one rotation for 243 Earth days). Meanwhile, about 60 km above Venus’ surface a speedy east wind circles the planet in about 4 Earth days (at 360 km/h), a phenomenon known as atmospheric superrotation.

The sky of Venus is fully covered by thick clouds of sulfuric acid that are located at a height of 45-70 km, making it hard to observe the planet’s surface from Earth-based telescopes and orbiters circling Venus. Surface temperatures reach a scorching 460 degrees Celsius, a harsh environment for any observations by entry probes. Due to these conditions, there are still many unknowns regarding Venus’ atmospheric phenomena.


Image above: Figure 1: (left) the lower clouds of Venus observed with the Akatsuki IR2 camera (after edge-emphasis process). The bright parts show where the cloud cover is thin. You can see the planetary-scale streak structure within the yellow dotted lines. (right) The planetary-scale streak structure reconstructed by AFES-Venus simulations. The bright parts show a strong downflow. (Partial editing of image in the Nature Communications paper. CC BY 4.0. Image Credit: JAXA/JAMSTEC.

To solve the puzzle of Venus’ atmosphere, the Japanese spacecraft Akatsuki began its orbit of Venus in December 2015. One of the observational instruments of Akatsuki is an infrared camera “IR2” that measures wavelengths of 2 μm (0.002 mm). This camera can capture detailed cloud morphology of the lower cloud levels, about 50 km from the surface. Optical and ultraviolet rays are blocked by the upper cloud layers, but thanks to infrared technology, dynamic structures of the lower clouds are gradually being revealed.

Before the Akatsuki mission began, the research team developed a program called AFES-Venus for calculating simulations of Venus’ atmosphere. On Earth, atmospheric phenomena on every scale are researched and predicted using numerical simulations, from the daily weather forecast and typhoon reports to anticipated climate change arising from global warming. For Venus, the difficulty of observation makes numerical simulations even more important, but this same issue also makes it hard to confirm the accuracy of the simulations.

AFES-Venus had already succeeded in reproducing superrotational winds and polar temperature structures of the Venus atmosphere. Using the Earth Simulator, a supercomputer system provided by the Japan Agency for Marine-Earth Science and Technology (JAMSTEC), the research team created numerical simulations at a high spatial resolution. However, because of the low quality of observational data before Akatsuki, it was hard to prove whether these simulations were accurate reconstructions.

This study compared detailed observational data of the lower cloud levels of Venus taken by Akatsuki’s IR2 camera with the high-resolution simulations from the AFES-Venus program. The left part of Figure 1 shows the lower cloud levels of Venus captured by the IR2 camera. Note the almost symmetrical giant streaks across the northern and southern hemispheres. Each streak is hundreds of kilometers wide and stretches diagonally almost 10,000 kilometers across. This pattern was revealed for the first time by the IR2 camera, and the team have named it a planetary-scale streak structure. This scale of streak structure has never been observed on Earth, and could be a phenomenon unique to Venus. Using the AFES-Venus high-resolution simulations, the team reconstructed the pattern (Figure 1 right-hand side). The similarity between this structure and the camera observations prove the accuracy of the AFES-Venus simulations.


Image above: Figure 2: The formation mechanism for the planetary-scale streak structure. The giant vortexes caused by Rossby waves (left) are tilted by the high-latitude jet streams and stretch (right). Within the stretched vortexes, the convergence zone of the streak structure is formed, a downflow occurs, and the lower clouds become thin. Venus rotates in a westward direction, so the jet streams also blow west. Image Credit: JAXA/JAMSTEC.

Next, through detailed analyses of the AFES-Venus simulation results, the team revealed the origin of this giant streak structure. The key to this structure is a phenomenon closely connected to Earth’s everyday weather: polar jet streams. In mid and high latitudes of Earth, a large-scale dynamics of winds (baroclinic instability) forms extratropical cyclones, migratory high-pressure systems, and polar jet streams. The results of the simulations showed the same mechanism at work in the cloud layers of Venus, suggesting that jet streams may be formed at high latitudes. At lower latitudes, an atmospheric wave due to the distribution of large-scale flows and the planetary rotation effect (Rossby wave) generates large vortexes across the equator to latitudes of 60 degrees in both directions (figure 2, left). When jet streams are added to this phenomenon, the vortexes tilt and stretch, and the convergence zone between the north and south winds forms as a streak. The north-south wind that is pushed out by the convergence zone becomes a strong downward flow, resulting in the planetary-scale streak structure (figure 2, right). The Rossby wave also combines with a large atmospheric fluctuation located over the equator (equatorial Kelvin wave) in the lower cloud levels, preserving the symmetry between hemispheres.

 Akatsuki: Japan's Mission to Study Climate of Venus. Image Credit: JAXA

This study revealed the giant streak structure on the planetary scale in the lower cloud levels of Venus, replicated this structure with simulations, and suggested that this streak structure is formed from two types of atmospheric fluctuations (waves), baroclinic instability and jet streams. The successful simulation of the planetary-scale streak structure formed from multiple atmospheric phenomena is evidence for the accuracy of the simulations for individual phenomena calculated in this process.

Until now, studies of Venus’ climate have mainly focused on average calculations from east to west. This finding has raised the study of Venus’ climate to a new level in which discussion of the detailed three-dimensional structure of Venus is possible. The next step, through collaboration with Akatsuki and AFES-Venus, is to solve the puzzle of the climate of Earth’s twin Venus, veiled in the thick cloud of sulfuric acid.

Journal information:

Paper:

“Planetary-scale streak structure reproduced in high-resolution simulations of the Venus atmosphere with a low-stability layer”.

Authors:

Hiroki Kashimura, Norihiko Sugimoto, Masahiro Takagi, Yoshihisa Matsuda, Wataru Ohfuchi, Takeshi Enomoto, Kensuke Nakajima, Masaki Ishiwatari, Takao M. Sato, George L. Hashimoto, Takehiko Satoh, Yoshiyuki O. Takahashi, Yoshi-Yuki Hayashi.

Journal:

Nature Communications.

References:

- Graduate School of Science, Kobe University: http://www.planet.sci.kobe-u.ac.jp/index_e.html

- Center for Planetary Science: https://www.cps-jp.org/?ml_lang=en

- Research and Education Center for Natural Sciences: http://www.sci.keio.ac.jp/en/

- Kyoto Sangyo University: https://www.kyoto-su.ac.jp/index-e.html

- JAMSTEC - JAPAN AGENCY FOR MARINE-EARTH SCIENCE AND TECHNOLOGY: http://www.jamstec.go.jp/e/

- Akatsuki project website: http://akatsuki.isas.jaxa.jp/en/

- ISAS / Institute of Space and Astronautical Science: http://www.isas.jaxa.jp/en/

- Venus Climate Orbiter "AKATSUKI" (PLANET-C): http://global.jaxa.jp/projects/sat/planet_c/index.html

Images (mentioned), Text, Credits: JAXA/JAMSTEC/Keio University/Kobe University.

Best regards, Orbiter.ch

Hubble sees the brightest quasar in the early Universe


ESA - Hubble Space Telescope logo.

10 January 2019

Artist’s impression of distant quasar

The NASA/ESA Hubble Space Telescope has discovered the brightest quasar ever seen in the early Universe. After 20 years of searching, astronomers have identified the ancient quasar with the help of strong gravitational lensing. This unique object provides an insight into the birth of galaxies when the Universe was less than a billion years old.

Astronomers using data from the NASA/ESA Hubble Space Telescope have discovered the brightest quasar ever seen in the early Universe — the light received from the object started its journey when the Universe was only about a billion years old.

Hubble’s view on distant quasar

Quasars are the extremely bright nuclei of active galaxies. The powerful glow of a quasar is created by a supermassive black hole which is surrounded by an accretion disc. Gas falling toward the black hole releases incredible amounts of energy, which can be observed over all wavelengths.

The newly discovered quasar, catalogued as J043947.08+163415.7 [1], is no exception to this; its brightness is equivalent to about 600 trillion Suns and the supermassive black hole powering it is several hundred million times as massive as our Sun. [2] “That’s something we have been looking for for a long time,” said lead author Xiaohui Fan (University of Arizona, USA). “We don’t expect to find many quasars brighter than that in the whole observable Universe!”

Artist’s impression of distant quasar

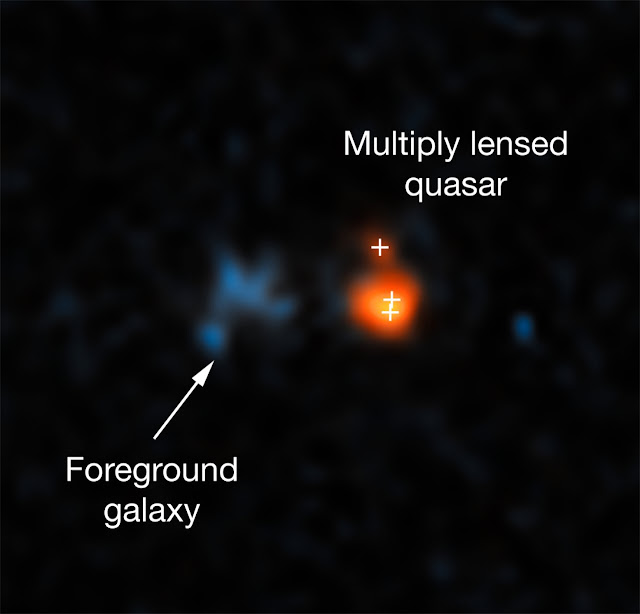
Despite its brightness Hubble was able to spot it only because its appearance was strongly affected by strong gravitational lensing. A dim galaxy is located right between the quasar and Earth, bending the light from the quasar and making it appear three times as large and 50 times as bright as it would be without the effect of gravitational lensing. Even still, the lens and the lensed quasar are extremely compact and unresolved in images from optical ground-based telescopes. Only Hubble’s sharp vision allowed it to resolve the system.

The data show not only that the supermassive black hole is accreting matter at an extremely high rate but also that the quasar may be producing up to 10 000 stars per year [3]. “Its properties and its distance make it a prime candidate to investigate the evolution of distant quasars and the role supermassive black holes in their centres had on star formation,” explains co-author Fabian Walter (Max Planck Institute for Astronomy, Germany), illustrating why this discovery is so important.

Gravitational lensing of distant quasar

Quasars similar to J043947.08+163415.7 existed during the period of reionisation of the young Universe, when radiation from young galaxies and quasars reheated the obscuring hydrogen that had cooled off just 400 000 years after the Big Bang; the Universe reverted from being neutral to once again being an ionised plasma. However, it is still not known for certain which objects provided the reionising photons. Energetic objects such as this newly discovered quasar could help to solve this mystery.

For that reason the team is gathering as much data on J043947.08+163415.7 as possible. Currently they are analysing a detailed 20-hour spectrum from the European Southern Observatory’s Very Large Telescope, which will allow them to identify the chemical composition and temperatures of intergalactic gas in the early Universe. The team is also using the Atacama Large Millimeter/submillimeter Array, and hopes to also observe the quasar with the upcoming NASA/ESA/CSA James Webb Space Telescope. With these telescopes they will be able to look in the vicinity of the supermassive black hole and directly measure the influence of its gravity on the surrounding gas and star formation.

Hubble Space Telescope (HST)

Notes:

[1] J043947.08+163415.7 was selected on the basis of its colour by combining photometric data from the United Kingdom Infra-Red Telescope Hemisphere Survey, the Panoramic Survey Telescope and Rapid Response System (Pan-STARRS1) at optical wavelengths, and the Wide-field Infrared Survey Explorer archive in the mid-infrared. Follow-up spectroscopic observations were conducted with the Multi-Mirror Telescope, the Gemini Observatory and the Keck Observatory.

[2] The brightness of the quasar includes the magnification factor of 50. Without the magnification through gravitational lensing the luminosity of the quasar is equivalent to about 11 trillion Suns.

[3] Because of the boosting effect of gravitational lensing, the actual rate of star formation could be much lower. By comparison, the Milky Way produces approximately one new star every year.

More information:

The Hubble Space Telescope is a project of international cooperation between ESA and NASA.

The results were presented at the 233rd meeting of the American Astronomical Society and will be published in the Astrophysical Journal Letters.

The international team of astronomers in this study consists of Xiaohui Fan (University of Arizona, USA), Feige Wang (University of California, USA), Jinyi Yang (University of Arizona, USA), Charles R. Keeton (Rutgers University, USA), Minghao Yue (University of Arizona, USA), Ann Zabludoff (University of Arizona, USA), Fuyan Bian (ESO, Chile), Marco Bonaglia (Arcetri Observatory, Italy), Iskren Y. Georgiev (Max Planck Institute for Astronomy, Germany), Joseph F. Hennawi (University of California, USA), Jiangtao Li (University of Michigan, USA), Jiangtao Li (University of Michigan, USA), Ian D. McGreer (University of Arizona, USA), Rohan Naidu (Center for Astrophysics, USA), Fabio Pacucci (Yale University, USA), Sebastian Rabien (Max Planck Institute for Extraterrestrial Physics, Germany), David Thompson (Large Binocular Telescope Observatory), Bram Venemans (Max Planck Institute for Astronomy, Germany), Fabian Walter (Max Planck Institute for Astronomy, Germany), Ran Wang (Peking University, China), Xue-Bing Wu (Peking University, China).

Links:

Images of Hubble: http://www.spacetelescope.org/images/archive/category/spacecraft/

Hubblesite release: http://hubblesite.org/news_release/news/2019-03

Keck Observatory release: http://www.keckobservatory.org/brightest_quasar

ESO's Very Large Telescope (VLT): http://www.eso.org/vlt

Atacama Large Millimeter/submillimeter Array (ALMA): http://www.eso.org/alma

NASA/ESA/CSA James Webb Space Telescope (JWST): http://sci.esa.int/jwst/

Images, Animation, Videos, Text, Credits:  credits: NASA/ESA/X. Fan et al. (University of Arizona)/Hubble/M. Kornmesser/L. Calçada.

Best regards, Orbiter.ch

XMM-Newton captures final cries of star shredded by black hole


ESA - XMM-Newton Mission patch.

10 January 2019

Astronomers using ESA's XMM-Newton space observatory have studied a black hole devouring a star and discovered an exceptionally bright and stable signal that allowed them to determine the black hole’s spin rate.  

Black holes are thought to lurk at the centre of all massive galaxies throughout the Universe, and are inextricably tied to the properties of their host galaxies. As such, revealing more about these behemoths may hold the key to understanding how galaxies evolve over time.

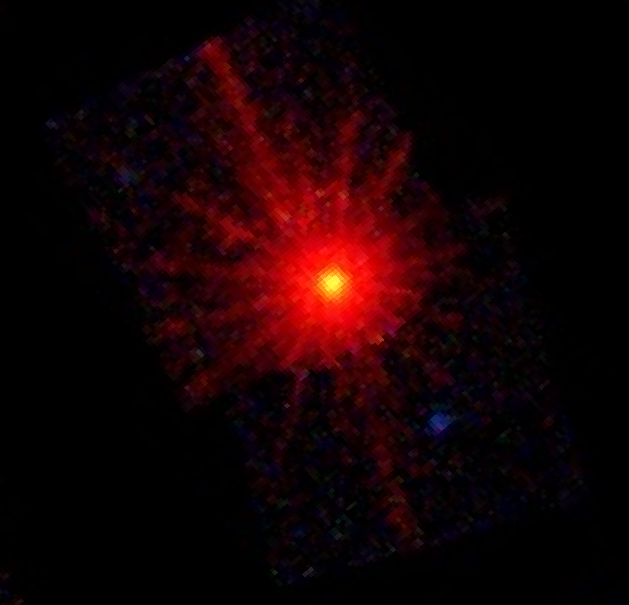
XMM-Newton view

A black hole’s gravity is extreme, and can rip apart stars that stray too close. The debris from such torn-apart stars spirals inwards towards the hole, heats up, and emits intense X-rays.

Despite the number of black holes thought to exist in the cosmos, many are dormant – there is no in-falling material to emit detectable radiation – and thus difficult to study. However, every few hundred thousand years or so, a star is predicted to pass near enough to a given black hole that it is torn apart. This offers a brief window of opportunity to measure some fundamental properties of the hole itself, such as its mass and the rate at which it is spinning.

“It’s very difficult to constrain the spin of a black hole, as spin effects only emerge very close to the hole itself, where gravity is intensely strong and it’s difficult to see clearly,” says Dheeraj Pasham of the MIT Kavli Institute for Astrophysics and Space Research in Massachusetts, USA, and lead author of the new study.

“However, models show that the mass from a shredded star settles into a kind of inner disc that throws off X-rays. We guessed that finding instances where this disc glows especially brightly would be a good way to constrain a black hole's spin, but observations of such events weren’t sensitive enough to explore this region of strong gravity in detail – until now.”

Artist’s impression of black hole

Dheeraj and colleagues studied an event called ASASSN-14li.

ASASSN-14li was discovered by the ground-based All-Sky Automated Survey for SuperNovae (ASASSN) on 22 November 2014. The black hole tied to the event is at least one million times as massive as the Sun.

“ASASSN-14li is nicknamed the ‘Rosetta Stone’ of these events,” adds Dheeraj. “All of its properties are characteristic of this type of event, and it has been studied by all currently operational major X-ray telescopes.”

Using observations of ASASSN-14li from ESA’s XMM-Newton and NASA’s Chandra and Swift X-ray observatories, the scientists hunted for a signal that was both stable and showed a characteristic wave pattern often triggered when a black hole receives a sudden influx of mass – such as when devouring a passing star.

They detected a surprisingly intense X-ray signal that oscillated over a period of 131 seconds for a long time: 450 days.

By combining this with information about the black hole’s mass and size, the astronomers found that the hole must be spinning rapidly – at more than 50% of the speed of light – and that the signal came from its innermost regions.

 Black hole host galaxy

“It’s an exceptional finding: such a bright signal that is stable for so long has never been seen before in the vicinity of any black hole,” adds co-author Alessia Franchini of the University of Milan, Italy.

“What’s more, the signal is coming from right near the black hole’s event horizon – beyond this point we can’t observe a thing, as gravity is so strong that even light can’t escape.”

The study demonstrates a novel way to measure the spins of massive black holes: by observing their activity when they disrupt passing stars with their gravity. Such events may also help us to understand aspects of general relativity theory; while this has been explored extensively in ‘normal’ gravity, it is not yet fully understood in regions where gravity is exceptionally strong.

XMM-Newton spacecraft

“XMM-Newton is incredibly sensitive to these signals, more so than any other X-ray telescope,” says ESA’s XMM-Newton Project Scientist Norbert Schartel. “The satellite provides the long, uninterrupted, detailed exposures that are crucial to detecting signals such as these.

“We’re only just beginning to understand the complex physics at play here. By finding instances where the mass from a shredded star glows especially brightly we can build a census of the black holes in the Universe, and probe how matter behaves in some of the most extreme areas and conditions in the cosmos.”

Notes for editors:

"A remarkably loud quasi-periodicity after a star is disrupted by a massive black hole" by D. R. Pasham et al. is published in the journal Science: http://science.sciencemag.org/content/early/2019/01/08/science.aar7480

Explore this object in ESASky: http://sky.esa.int/?action=goto&target=192.0634350305993%2017.7740268387588&hips=XMM-Newton%20EPIC%20color&fov=0.3994938290667491&cooframe=J2000&sci=true

ESA's XMM-Newton: http://www.esa.int/Our_Activities/Space_Science/XMM-Newton_overview

Images, Videos, Text, Credits: ESA/XMM-Newton/Markus Bauer/Norbert Schartel/University of Milan/Alessia Franchini/MIT Kavli Institute for Astrophysics and Space Research/Dheeraj Pasham/NASA/CXC/M. Weiss/CXC/MIT/HST/STScI/I. Arcavi.

Best regards, Orbiter.ch