mardi 19 novembre 2013

Debris from stellar explosions in the Galaxy's fast lane


ESA - Integral Mission patch.

19 November 2013

Astronomers looking at the radioactive afterglow of supernovae with ESA's INTEGRAL mission have revealed that the remains of stellar explosions move through the Milky Way much faster, on average, than stars and most of the Galaxy's gas. This stellar debris is most likely ejected by winds and supernova explosions in large groups of massive stars located primarily on the leading edges of the Galaxy's spiral arms.

While the night sky delivers a peaceful and almost immutable cosmic view, the picture belies a Universe alive with ceaseless motion from the smallest to the largest scales. All structures in the Milky Way, both the stars and the diffuse interstellar medium, swirl around the centre of the Galaxy at velocities as high as hundreds of kilometres per second, taking about one hundred million years to complete a revolution.

Artist's impression of our Galaxy

By studying how these objects move, astronomers can figure out the structure of the Milky Way at large and, in particular, of the spiral arms – a prominent characteristic of our Galaxy. These investigations are key in the challenge of understanding the history of the Milky Way's evolution.

Using data from ESA's INTEGRAL mission, a team of astronomers has mapped out galactic motions, exploiting a new tracer that follows stellar debris both through space and time. With this new method, they revealed that the remains of stellar explosions move, on average, much faster than stars and most of the gas in the Milky Way.

"The stellar winds blown by a massive star, and the supernova explosions at the end of its life, are powerful agents. They release large amounts of matter and energy into interstellar space, and we managed to trace some of this matter during its very long journey," explains Karsten Kretschmer from the Laboratoire APC in Paris, France. Kretschmer is the lead author of the paper reporting on the new results, published in Astronomy & Astrophysics.

The astronomers traced the path of the supernova debris by tracking its velocity relative to us through the Galaxy. They sought the light emitted at a specific gamma-ray wavelength by the radioactive decay of aluminium-26 (26Al), an isotope produced in the supernova explosions. Matter ejected by a supernova is richer in heavy elements than the raw material from which the parent star formed, because many new atomic nuclei are created in the star's interior as well as during the explosion.

Part of the ejected material is in the form of nuclei of radioactive isotopes, and the majority of them decay over short timescales – ranging between a few days and several years. But not 26Al. With a half-life of about 700 000 years, 26Al nuclei can travel very long distances before they decay. When they do so, astronomers can exploit the gamma rays emitted during the decay to trace the long-term reach of stellar explosions.

"Looking at the radioactive afterglow of supernovae about a million years after the explosions, we followed how their debris has spread across the Galaxy. This is not possible with observations at other wavelengths, which only show the remnants of more recent supernovae," adds Kretschmer.

Kretschmer and his collaborators used the SPectrometer on INTEGRAL (SPI) instrument to search for the emission from the radioactive decay of 26Al. With these data, they could map the distribution and velocity of this isotope across the Milky Way.

"Surprisingly, during the first million years of their journey, the ejecta from supernovae seem to move, on average, twice as fast as stars and the diffuse gas we see at other wavelengths in the Galaxy," comments co-author Roland Diehl from the Max-Planck Institut für Extraterrestrische Physik in Munich, Germany.

"We expected such high velocities in the initial phase after the explosion, but not after a million years. Our measurements are unique as they can detect the motion of the debris on such a long time scale, but still before it is slowed down as it ploughs through the surrounding gas that moves with the general flow."

The astronomers also found that supernovae tend to be more abundant in the inner parts of the Milky Way, where the spiral arms stem from the central regions of the Galaxy, rather than at the periphery.

"We conclude that the ejecta from supernovae are mainly concentrated towards the leading edges of the arms, while most of the gas and dust from which stars take shape are located in the core of the arms," he adds.

This offset in velocity and location between the cradles of star formation and the graveyard of stellar remains suggests the existence of strong asymmetries in the outflows from massive stars and supernovae within the Galaxy.

Stars form deep within the spiral arms, but may migrate outwards during their lifetime. The most massive of them blow intense winds during their lifetime and eventually die as supernovae. The material ejected during these events proceeds faster towards the regions of the Milky Way between the arms, creating gigantic bubbles that expand more easily in those directions where interstellar material is less dense.

"From the images of nearby spiral galaxies at optical and ultraviolet wavelengths, previous studies had already suggested that massive stars and supernovae may be preferentially located on the edges of spiral arms. Now, we have obtained direct proof," says Kretschmer.

The result will help astronomers piece together the turbulent journey of matter across the Galaxy, from one generation of stars to the next. It is also a valuable clue to investigate how the complex structure of arms arises in spiral galaxies.

Artist's impression of  ESA's INTEGRAL spacecraft

Many observations were needed in this study to gain optimal control over the spectral resolution of the SPI instrument, which varies over time.

"We had to collect data over almost ten years to achieve the spectral resolution required for this study," notes Diehl.

"This velocity measurement is an unprecedented technical result at these wavelengths: with such a high spectral resolution, SPI is and will remain a unique instrument for years to come."

The motion of 26Al nuclei rotating in the Galaxy was already evident in the results from an earlier study, based on INTEGRAL data and published in 2006. But longer monitoring and improved spectral resolution were crucial to pinpoint the velocity of these nuclei to great precision.

"The goal of this study was very ambitious: looking at stellar aftermaths that only INTEGRAL can see. And we've succeeded, revealing that they move much faster than we could imagine," concludes Erik Kuulkers, ESA's INTEGRAL Project Scientist.

Background information:

The results described in this article are reported in "Kinematics of massive star ejecta in the Milky Way as traced by 26Al", by K. Kretschmer et al., published in Astronomy & Astrophysics, 559, A99, 2013; 10.1051/0004-6361/201322563. The study is based on data collected with the SPI (Spectrometer on INTEGRAL) instrument on board ESA's INTEGRAL mission. The data were collected between February 2003 and February 2012.

The International Gamma-ray Astrophysics Laboratory (INTEGRAL) was launched on 17 October 2002. It is an ESA project with the instruments and a science data centre funded by ESA Member States (especially the Principal Investigator countries: Denmark, France, Germany, Italy, Spain, Switzerland) and Poland, and with the participation of Russia and the USA. The mission is dedicated to the fine spectroscopy (E/∆E = 500) and fine imaging (angular resolution: 12 arcmin FWHM) of celestial gamma-ray sources in the energy range 15 keV to 10 MeV with concurrent source monitoring in the X-ray (4-35 keV) and optical (V-band, 550 nm) energy ranges.

For more information about Integral Mission, visit: http://sci.esa.int/integral/

Image, Text, Credit: ESA / C. Carreau / INTEGRAL Project Scientist, Erik Kuulkers / Max-Planck Institute for Extraterrestrial Physics, Roland Diehl / Laboratoire APC - AstroParticule et Cosmologie
Université Paris Diderot, Karsten Kretschmer.

Best regards, Orbiter.ch

lundi 18 novembre 2013

New Cassini Image of Sunlit Clouds on Saturn


NASA / ESA - Cassini Mission to Saturn patch.

Nov. 18, 2013

Impressionistic Saturn

To the Cassini spacecraft's infrared eyes, Saturn's graceful clouds sometimes take on the appearance of an impressionist's painting of the giant planet.

This view looks toward the sunlit side of the rings from about 18 degrees above the ringplane. The image was taken with the Cassini spacecraft wide-angle camera on Aug. 12, 2013 using a spectral filter sensitive to wavelengths of near-infrared light centered at 728 nanometers.

The view was acquired at a distance of approximately 994,000 miles (1.6 million kilometers) from Saturn. Image scale is 57 miles (92 kilometers) per pixel.

The Cassini-Huygens mission is a cooperative project of NASA, the European Space Agency and the Italian Space Agency. The Jet Propulsion Laboratory, a division of the California Institute of Technology in Pasadena, manages the mission for NASA's Science Mission Directorate, Washington, D.C. The Cassini orbiter and its two onboard cameras were designed, developed and assembled at JPL. The imaging operations center is based at the Space Science Institute in Boulder, Colo.

For more information about the Cassini-Huygens mission visit http://www.nasa.gov/cassini, http://saturn.jpl.nasa.gov . The Cassini imaging team homepage is at http://ciclops.org and http://www.esa.int/Our_Activities/Space_Science/Cassini-Huygens

Image, Text, Credit: NASA / JPL-Caltech / Space Science Institute.

Greetings, Orbiter.ch

MAVEN Launches on Ten-Month Journey to Mars Orbit


NASA - MAVEN Mission patch.

Nov. 18, 2013


At 1:28 p.m. EST, NASA's Mars Atmosphere and Volatile EvolutioN (MAVEN) spacecraft launched aboard a United Launch Alliance Atlas V rocket from Cape Canaveral Air Force Station in Florida, beginning a 10-month journey to Mars orbit. MAVEN will take critical measurements of the Martian upper atmosphere to help scientists understand climate change over the Red Planet's history.

Liftoff of MAVEN

NASA's next Mars explorer leave Earth on a mission to answer one of the Red Planet's greatest conundrums: If our arid celestial neighbor once had a thicker atmosphere and a surface flowing with water, as evidence suggests, how did the climate change so dramatically?

Jakosky, of the Laboratory for Atmospheric and Space Physics (LASP) at the University of Colorado at Boulder, leads the mission and has been involved in the flight since its inception. The mission is designed to search for clues into the thinning of Mars' atmosphere and the disappearance of surface water over time. Scientists theorize the sun may have had a role in the escape of gas from the planet's upper atmosphere -- a region that hasn't yet been studied.

Since 1964, NASA has flown a series of orbiters, landers and rovers to Mars, searching for chemical traces of water or signs that the planet once could harbor life. MAVEN stands apart from these because it's the first to focus exclusively on the upper reaches of the planet's atmosphere.

"Mars is a complicated system, just as complicated as the Earth in its own way," Jakosky said. "You can't hope, with a single spacecraft, to study all aspects and to learn everything there is to know about it. With MAVEN, we're exploring the single biggest unexplored piece of Mars so far."

The spacecraft will arrive at the Red Planet on Sept. 22, 2014, and slip into an elliptical orbit ranging from a low of 93 miles above the surface to a high of 3,728 miles. It also will take five "deep dips" during the course of the mission, flying as low as 77 miles in altitude and providing a cross-section of the top of the atmosphere.

MAVEN spacecraft in orbit around Mars

MAVEN is an eight-foot cube weighing about 5,400 pounds at launch -- as much as a fully loaded sport utility vehicle. With its twin pairs of gull-wing-shaped solar panels extended, it stretches 37 feet from wingtip to wingtip.

The spacecraft is outfitted with a trio of instrument suites. The Particles and Fields Package, built by the University of California at Berkeley Space Sciences Laboratory, contains six individual instruments that characterize the solar wind and ionosphere of the planet. The Remote Sensing Package, built by LASP, will determine global characteristics of the upper atmosphere and ionosphere. The Neutral Gas and Ion Mass Spectrometer, built by NASA's Goddard Space Flight Center, will measure the composition and isotopes of neutrals and ions.

Planning the MAVEN mission has been a team effort involving several partners. NASA Goddard in Greenbelt, Md., manages the project and provided two of the science instruments for the mission. Lockheed Martin built the spacecraft and is responsible for mission operations. The University of California at Berkeley's Space Sciences Laboratory provided science instruments for the mission. NASA's Jet Propulsion Laboratory in Pasadena, Calif., provides navigation support, Deep Space Network support, and Electra telecommunications relay hardware and operations.

For more information about MAVEN Mission, visit: http://www.nasa.gov/mission_pages/maven/main/

Images, Video, Text, Credits: NASA / NASA TV.

Best regards, Orbiter.ch

Galactic cauldron


ESA - XMM-Newton Mission patch.

Nov. 18, 2013

Hot gas sloshing in a galactic cauldron

Galaxies are social beasts that are mostly found in groups or clusters – large assemblies of galaxies that are permeated by even larger amounts of diffuse gas. With temperatures of 10 million degrees or more, the gas in galaxy groups and clusters is hot enough to shine brightly in X-rays and be detected by ESA’s XMM-Newton X-ray observatory.

As galaxies speed through these gigantic cauldrons, they occasionally jumble the gas and forge it into lop-sided shapes. An example is revealed in this composite image of the galaxy group NGC 5044, the brightest group in X-rays in the entire sky.

The group is named after the massive and bright elliptical galaxy at its centre, surrounded by tens of smaller spiral and dwarf galaxies. The galaxies are shown in a combination of optical images from the Digitized Sky Survey with infrared and ultraviolet images from NASA’s WISE and Galex satellites, respectively. Foreground stars are also sprinkled across the image.

The large blue blob shows the distribution of hot gas filling the space between NGC 5044’s galaxies as imaged by XMM-Newton. From the X-ray observations, astronomers can also see the glow of iron atoms that were forged in stellar explosions within the galaxies of the group but streamed beyond. The distribution of iron atoms is shown in purple.

Embedded within the hot gas are clouds of even more energetic plasma that emit radio waves – a reminder of the past activity of a supermassive black hole lurking at the centre of the group. These are the green filament extending from the central galaxy to the lower right and the larger green region to its lower left, which were imaged with the Giant Metrewave Radio Telescope, near Pune in India.

The distribution of the intergalactic gas and its ingredients is asymmetric, with a larger splotch in the upper right part of the image and a smaller one in the lower left.

XMM-Newton spacecraft

Astronomers believe that gas in NGC 5044 is sloshing as a consequence of a galaxy that passed through it several millions of years ago. The culprit is the spiral galaxy NGC 5054, which is not visible here, instead hiding beyond its lower left corner.

The transit of NGC 5054 through the centre of the group may have also caused the twisted shape of the radio-bright filament.

This image was first published in the XMM-Newton Image Gallery in October 2013. The analysis is reported in the paper by E. O’Sullivan et al. “The impact of sloshing on the intra-group medium and old radio lobe of NGC 5044.”

For more information about XMM-Newton Mission, Visit: http://sci.esa.int/xmm-newton/ and XMM-Newton Operations Centre: http://xmm.esac.esa.int/

Images, Text, Credits: ESA / E. O’Sullivan.

Greetings, Orbiter.ch

New Image of Comet ISON


ESO - European Southern Observatory logo.

Nov. 18, 2013


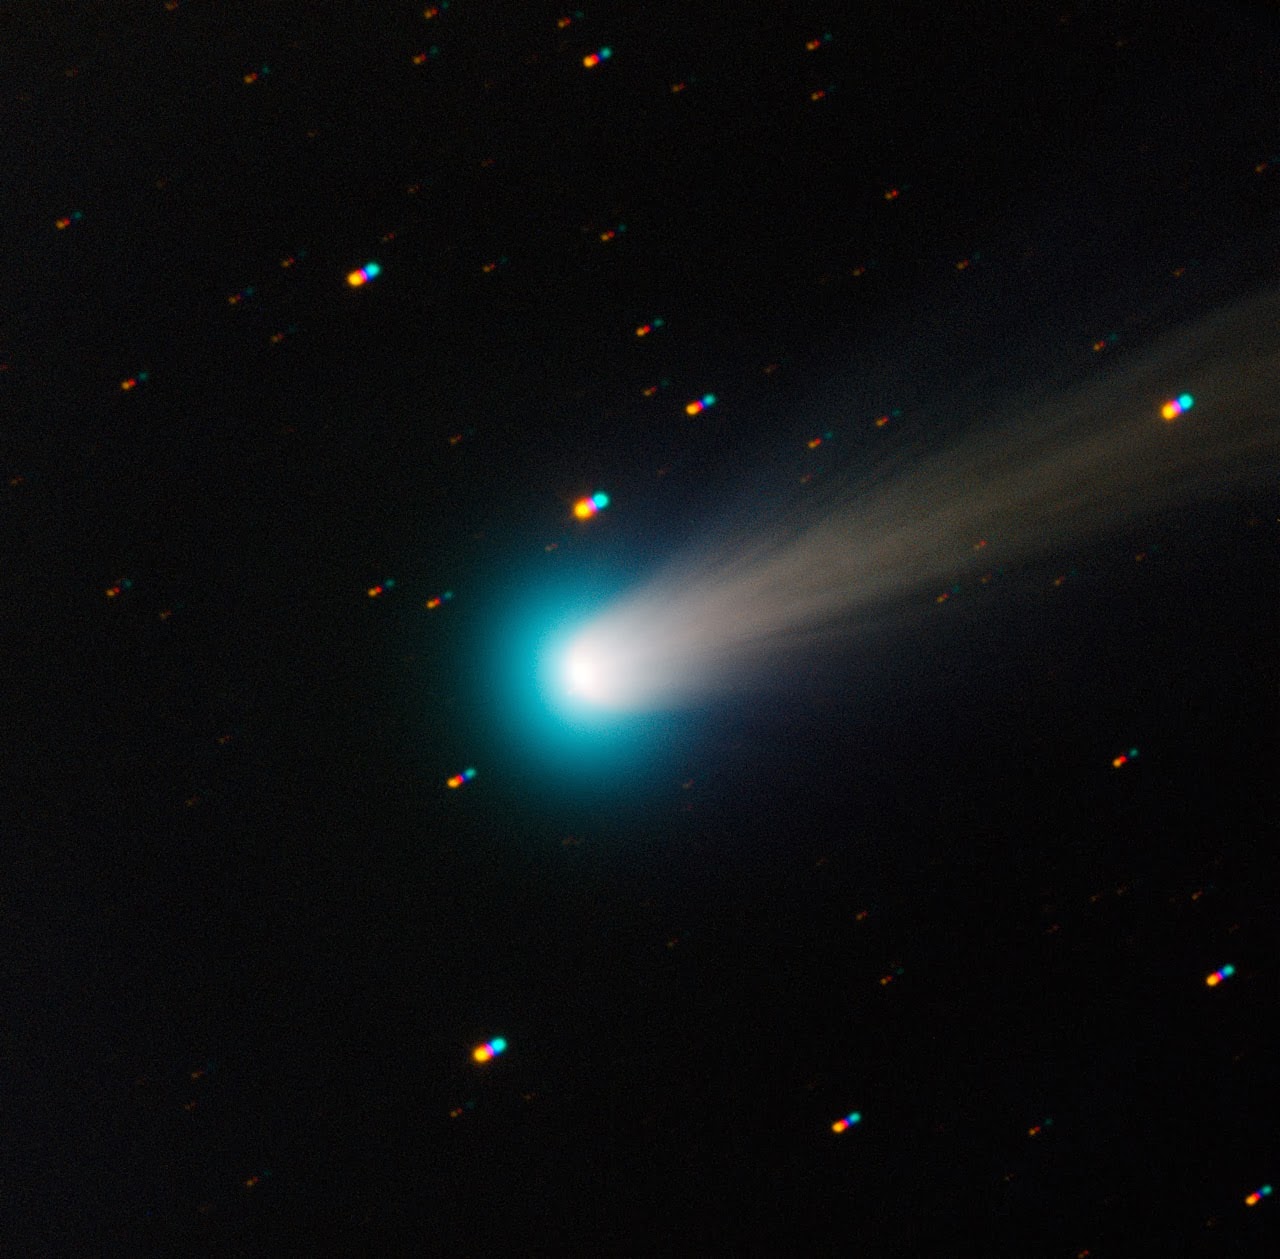
This new view of Comet C/2012 S1 (ISON) was taken with the TRAPPIST national telescope at ESO's La Silla Observatory on the morning of Friday 15 November 2013. Comet ISON was first spotted in our skies in September 2012, and will make its closest approach to the Sun in late November 2013.

TRAPPIST has been monitoring comet ISON since mid-October, using broad-band filters like those used in this image. It has also been using special narrow-band filters which isolate the emission of various gases, allowing astronomers to count how many molecules of each type are released by the comet.

Comet ISON was fairly quiet until 1 November 2013, when a first outburst doubled the amount of gas emitted by the comet. On 13 November, just before this image was taken, a second giant outburst shook the comet, increasing its activity by a factor of ten. It is now bright enough to be seen with a good pair of binoculars from a dark site, in the morning skies towards the East. Over the past couple of nights, the comet has stabilised at its new level of activity.

These outbursts were caused by the intense heat of the Sun reaching ice in the tiny nucleus of the comet as it zooms toward the Sun, causing the ice to sublimate and throwing large amounts of dust and gas into space. By the time ISON makes its closest approach to the Sun on 28 November (at only 1.2 million kilometres from its surface — just a little less than the diameter of the Sun!), the heat will cause even more ice to sublimate. However, it could also break the whole nucleus down into small fragments, which would completely evaporate by the time the comet moves away from the Sun's intense heat. If ISON survives its passage near the Sun, it could then become spectacularly bright in the morning sky.

The image is a composite of four different 30-second exposures through blue, green, red, and near-infrared filters. As the comet moved in front of the background stars, these appear as multiple coloured dots.

TRAPPIST (TRAnsiting Planets and PlanetesImals Small Telescope) is devoted to the study of planetary systems through two approaches: the detection and characterisation of planets located outside the Solar System (exoplanets), and the study of comets orbiting around the Sun. The 60-cm national telescope is operated from a control room in Liège, Belgium, 12 000 km away.

Links:

TRAPPIST page at University of Liège: http://www.orca.ulg.ac.be/TRAPPIST

Image, Text, Credits: ESO / TRAPPIST / E. Jehin.

Cheers, Orbiter.ch

vendredi 15 novembre 2013

'Murray Ridge' on Rim of Endeavour Crater on Mars


NASA - Mars Science Laboratory (MSL) patch.

Nov. 15, 2013


This scene shows the "Murray Ridge" portion of the western rim of Endeavour Crater on Mars. The ridge is the NASA's Mars Exploration Rover Opportunity's work area for the rover's sixth Martian winter.

The ridge rises about 130 feet (40 meters) above the surrounding plain, between "Solander Point" at the north end of the ridge and "Cape Tribulation," beyond Murray Ridge to the south. This view does not show the entire ridge. The visible ridge line is about 10 meters (33 feet) above the rover's location when the component images were taken.

The scene sweeps from east to south. The planar rocks in the foreground at the base of the hill are part of a layer of rocks laid down around the margins of the crater rim. At this location, Opportunity is sitting at the contact between the Meridiani Planum sandstone plains and the rocks of the Endeavour Crater rim. On the upper left, the view is directed about 22 kilometers (14 miles) across the center of Endeavour crater to the eastern rim.

Opportunity landed on Mars in January 2004 and has been investigating parts of Endeavour's western rim since August 2011.

Artist's view of the Mars Science Laboratory (MSL) "Curiosity" on Mars

The scene combines several images taken by the panoramic camera (Pancam) on NASA's Mars Exploration Rover Opportunity during the 3,446th Martian day, or sol, of the mission's work on Mars (Oct. 3, 2013) and the following three sols. On Sol 3451 (Oct. 8, 2013), Opportunity began climbing the ridge. The slope offers outcrops that contain clay minerals detected from orbit and also gives the rover a northward tilt that provides a solar-energy advantage during the Martian southern hemisphere's autumn and winter.

The rover team chose to call this feature Murray Ridge in tribute to Bruce Murray (1931-2013), an influential advocate for planetary exploration who was a member of the science teams for NASA's earliest missions to Mars and later served as director of NASA's Jet Propulsion Laboratory, in Pasadena.

This view is presented in approximately true color, merging exposures taken through three of the Pancam's color filters, centered on wavelengths of 753 nanometers (near-infrared), 535 nanometers (green) and 432 nanometers (violet).

NASA's Mars Science Laboratory Project is using Curiosity to assess whether areas inside Gale Crater ever offered a habitable environment for microbes. JPL, a division of the California Institute of Technology in Pasadena, manages the project for NASA's Science Mission Directorate in Washington.

More information about Curiosity is online at http://www.nasa.gov/msl and http://mars.jpl.nasa.gov/msl/ . You can follow the mission on Facebook at: http://www.facebook.com/marscuriosity and on Twitter at: http://www.twitter.com/marscuriosity

Images, Text, Credits: NASA / JPL-Caltech / Cornell / ASU.

Best regards, Orbiter.ch

jeudi 14 novembre 2013

NASA-USGS Landsat Data Yield Best View to Date of Global Forest Losses, Gains


NASA - U.S. Geological Survey Landsat 7 satellite patch.

Nov. 14, 2013

The ravages of deforestation, wildfires, windstorms and insects on global forests during this century are revealed in unprecedented detail in a new study based on data from the NASA-U.S. Geological Survey Landsat 7 satellite.

 Landsat 7 satellite in orbit. Image Credit:  NASA

The maps resulting from the study are the first to document forest loss and gain using a consistent method around the globe, at high resolution. They allow scientists to compare forest changes in different countries and monitor annual deforestation. With each pixel in a Landsat image showing an area about the size of a baseball diamond, researchers see enough detail to tell local, regional and global stories.

“Now, we have 12 years of annual forest loss over the globe,” said Matthew Hansen, whose team at the University of Maryland in College Park, Md., led the new study.


Image above: Using Landsat imagery and cloud computing, researchers mapped forest cover worldwide as well as forest loss and gain. Over 12 years, 888,000 square miles (2.3 million square kilometers) of forest were lost, and 309,000 square miles (800,000 square kilometers) regrew. Image Credit:  NASA Goddard, based on data from Hansen et al., 2013.

Hansen and colleagues analyzed 143 billion pixels in 654,000 Landsat images to compile maps of forest loss and gain between 2000 and 2012. During that period, 888,000 square miles (2.3 million square kilometers) of forest were lost, and 309,000 square miles (800,000 square kilometers) regrew. The researchers, including scientists from the University of Maryland, Google, the State University of New York, Woods Hole Research Center, the U.S. Geological Survey (USGS) and South Dakota State University, published their work in the Nov. 15 issue of the journal Science.

Key to the project was collaboration with team members from Google Earth Engine, who reproduced in the Google Cloud the models developed at the University of Maryland for processing and characterizing the Landsat data.

During the study period, Brazil cut its deforestation rate from approximately 15,400 square miles (40,000 square kilometers) per year to approximately 7,700 square miles (20,000 square kilometers) per year.

"That's the result of a concerted policy effort to reduce deforestation, and it sets a standard for the rest of the world," Hansen said.

The team found that the deforestation rate in other countries increased.  Indonesia's deforestation rate doubled in the study period, from approximately 3,900 square miles (10,000 square kilometers) per year in 2000-2003 to more than 7,700 square miles (20,000 square kilometers) in 2011-2012.


Image above: The border between Malaysia and Indonesia on the island of Borneo stands out in the Landsat-based map of forest disturbance. Red pixels represent forest loss between 2000 and 2012. Image Credit: NASA Goddard, based on data from Hansen et al., 2013.

Prior to this study, country-to-country comparisons of forestry data were not possible at this level of accuracy. Different countries define forests differently, making previous global comparisons difficult with existing inventories.

"When you put together datasets that employ different methods and definitions, it's hard to synthesize," Hansen said. "But with Landsat, as a polar-orbiting instrument that takes the same quality pictures everywhere, we can apply the same algorithm to forests in the Amazon, in the Congo, in Indonesia, and so on. It's a huge improvement in our global monitoring capabilities."

"Since the first Landsat satellite launched 41 years ago, scientists have been improving their land cover analysis as computers have become more powerful," said Jeff Masek, Landsat project scientist at NASA's Goddard Space Flight Center in Greenbelt, Md. "Projects like Hansen's took a big leap forward once USGS made the data freely available on the Internet in 2008."

"This is the first time somebody has been able to do a wall-to-wall, global Landsat analysis of all the world's forests -- where they're being cleared, where they're regrowing, and where they're subject to natural disturbances," Masek said, noting that the maps could be routinely updated to aid in carbon accounting and other studies of land cover change.

The maps also illustrate the impact of politics on land cover. On the island of Borneo, the maps clearly show the border between Malaysia and Indonesia. Malaysia's heavy logging along forest roads is visible right up to the Indonesian border, where forests were still largely intact as of 2012. In Côte d'Ivoire, a civil war in 2002 corresponded with intense deforestation of several previously protected nature reserves.


Image above: Civil unrest in Côte d'Ivoire was associated with widespread deforestation in national parks, including Marahoué National Park. Other protected areas, such as Tai National Park, remained intact. Image Credit: NASA Goddard, based on data from Hansen et al., 2013.

A different pattern of change appears in the southeastern U.S., where landowners harvest trees for timber and quickly plant their replacements.

"Of this eco-region in the southeast, 30 percent of the forest land was regrown or lost during this period," Hansen said. "It's incredibly intensive. Trees are really treated like a crop in this region."


Image above: The forest cover maps also capture natural disturbances such as this 2011 tornado path in Alabama. In this map, the colors represent forest loss by year, with yellows representing loss closer to 2000 and reds representing later forest loss, up to 2012. Image Credit: NASA Goddard, based on data from Hansen et al., 2013.

In Alabama, Landsat also detected miles-long streaks of destroyed forest. When the researchers examined the year-by-year record, they found the damage occurred in 2011 after a violent tornado season.

Since 1972, the Landsat program has played a critical role in monitoring, understanding and managing the resources needed to sustain human life such as food, water and forests. Landsat 8 was launched Feb. 11 and is managed jointly by NASA and USGS to continue the 40-plus years of Earth observations.

To view the forest cover maps in Google Earth Engine, visit: http://earthenginepartners.appspot.com/google.com/science-2013-global-forest

For more information about the Landsat satellites, visit: http://www.nasa.gov/landsat

Images (mentioned), Text, Credit: NASA's Goddard Space Flight Center / Kate Ramsayer.

Greetings, Orbiter.ch