samedi 22 février 2014

United Launch Alliance (ULA) Delta IV successfully launches with GPS IIF-5


ULA - Delta IV / GPS IIF-5 launch poster.

February 22, 2014

 United Launch Alliance (ULA) Delta IV rocket on the launch-pad

The US Air Force’s fifth GPS Block IIF navigation satellite was launched on Thursday night. Liftoff, from Cape Canaveral Air Force Station in Florida, via the United Launch Alliance (ULA) Delta IV rocket, came at the end of a nineteen-minute window, resulting in a T-0 of 8:59 pm Eastern (01:59 UTC on Friday 21 February 2014). The delay in the window was caused by high solar activity.

United Launch Alliance (ULA) Delta IV rocket liftoff

Built by Boeing, GPS IIF-5 is the fifth of twelve Block IIF satellites intended to replace older satellites in the Global Positioning System and introduce new capabilities ahead of the Block III series scheduled to begin launching in the next few years. Each satellite has a mass of 1,630 kilograms (3,534 lb) and is designed for twelve years’ service life.

Launch of GPS IIF-5 Satellite on Delta IV Medium Rocket

GPS satellites operate in semi-synchronous orbits with periods of twelve hours, making two revolutions per day. The constellation consists of six planes, designated A to F. In theory each plane should have four primary satellites in slots one to four, with a spare in slot five, however some planes have more than one backup; some of these satellites are kept operational in “slot six”, while others are in standby status.

Destined for slot 3 of plane A of the GPS constellation, GPS IIF-5 is scheduled to replace the USA-135 satellite, also known as GPS IIA-28, which was launched in November 1997. The nineteenth and final Block IIA satellite to fly, USA-135 will likely be moved to slot 5, which is typically occupied by an older, backup satellite.

Artist's view of the GPS IIF-5 satellite

The rocket that launched GPS IIF-5, United Launch Alliance’s Delta IV, conducted its twenty-fifth flight. Flying in the Medium+(4,2) configuration – its most-used variant – the rocket consists of a Common Booster Core (CBC) augmented by a pair of GEM-60 solid rocket motors, with a four-meter Delta Cryogenic Second Stage (DCSS) mounted atop the CBC.

The Common Booster Core is powered by a single RS-68 engine, while the DCSS makes use of an RL10B. Both core stages make use of cryogenic propellents, burning liquid hydrogen in a liquid oxygen oxidiser.

Delta IV rocket description

Originally developed by the US Air Force for military applications, President Ronald Reagan ordered that the Global Positioning System be made available to civilian users after a Korean Air Lines Boeing 747 was shot down after going off course and entering restricted Soviet airspace. The satellites broadcast freely-available civilian signals, and military ones with greater precision.

For more information about United Launch Alliance (ULA), visit: http://www.ulalaunch.com/site/default.shtml

For more information about GPS satellites, visit: http://en.wikipedia.org/wiki/Global_Positioning_System

Images, Video, Text, Credits: United Launch Alliance (ULA) / Orbiter.ch Aerospace.

Greetings, Orbiter.ch

vendredi 21 février 2014

NASA's IRIS Spots Its Largest Solar Flare


NASA - Interface Region Imaging Spectrograph (IRIS) logo.

February 21, 2014

IRIS Spots Its Largest Solar Flare

Video above: On Jan. 28, 2014, NASA's newly-launched Interface Region Imaging Spectrometer, or IRIS, observed its strongest solar flare to date. Image Credit: NASA/IRIS/SDO/Goddard Space Flight Center.

On Jan. 28, 2014, NASA's Interface Region Imaging Spectrograph, or IRIS, witnessed its strongest solar flare since it launched in the summer of 2013. Solar flares are bursts of x-rays and light that stream out into space, but scientists don't yet know the fine details of what sets them off.

IRIS peers into a layer of the sun's lower atmosphere just above the surface, called the chromosphere, with unprecedented resolution. However, IRIS can't look at the entire sun at the same time, so the team must always make decisions about what region might provide useful observations. On Jan. 28, scientists spotted a magnetically active region on the sun and focused IRIS on it to see how the solar material behaved under intense magnetic forces. At 2:40 p.m. EST, a moderate flare, labeled an M-class flare -- which is the second strongest class flare after X-class – erupted from the area, sending light and x-rays into space.


Image above: On Jan. 28, 2014, NASA's IRIS witnessed its strongest solar flare since it launched in the summer of 2013. Image Credit: NASA/IRIS.

IRIS studies the layer of the sun’s atmosphere called the chromosphere that is key to regulating the flow of energy and material as they travel from the sun's surface out into space. Along the way, the energy heats up the upper atmosphere, the corona, and sometimes powers solar events such as this flare.

IRIS is equipped with an instrument called a spectrograph that can separate out the light it sees into its individual wavelengths, which in turn correlates to material at different temperatures, velocities and densities. The spectrograph on IRIS was pointed right into the heart of this flare when it reached its peak, and so the data obtained can help determine how different temperatures of material flow, giving scientists more insight into how flares work.

Interface Region Imaging Spectrograph (IRIS)spacecraft. Image Credit: NASA

The IRIS mission is managed by the Lockheed Martin Solar and Astrophysics Laboratory of the ATC in Palo Alto, Calif. NASA’s Ames Research Center in Moffett Field, Calif., is responsible for mission operations and the ground data system. The Ames Pleiades supercomputer is used to carry out many of the numerical simulations that are led by the University of Oslo. The IRIS telescope was designed and built by the Smithsonian Astrophysical Observatory while Montana State University faculty and students assisted in the design of the spectrograph. A large volume of science data is downlinked via Kongsberg Satellite Services, (KSAT) facilities through a cooperative agreement between NASA and the Norwegian Space Centre.  NASA’s Goddard Space Flight Center in Greenbelt, Md., oversees the Explorers Program from which IRIS evolved.

For more information about IRIS mission, visit: http://iris.gsfc.nasa.gov/ and http://science.nasa.gov/missions/iris/

Images (mentioned), Video (mentioned), Text, Credits: NASA's Goddard Space Flight Center / Karen C. Fox.

Best regards, Orbiter.ch

The Shocking Behavior of a Speedy Star


NASA - Spitzer Space Telescope patch.

February 20, 2014


Image above: The red arc in this infrared image from NASA's Spitzer Space Telescope is a giant shock wave, created by a speeding star known as Kappa Cassiopeiae. Image Credit: NASA/JPL-Caltech.

Roguish runaway stars can have a big impact on their surroundings as they plunge through the Milky Way galaxy. Their high-speed encounters shock the galaxy, creating arcs, as seen in this newly released image from NASA’s Spitzer Space Telescope.

In this case, the speedster star is known as Kappa Cassiopeiae, or HD 2905 to astronomers. It is a massive, hot supergiant moving at around 2.5 million mph relative to its neighbors (1,100 kilometers per second). But what really makes the star stand out in this image is the surrounding, streaky red glow of material in its path. Such structures are called bow shocks, and they can often be seen in front of the fastest, most massive stars in the galaxy.

Bow shocks form where the magnetic fields and wind of particles flowing off a star collide with the diffuse, and usually invisible, gas and dust that fill the space between stars. How these shocks light up tells astronomers about the conditions around the star and in space. Slow-moving stars like our sun have bow shocks that are nearly invisible at all wavelengths of light, but fast stars like Kappa Cassiopeiae create shocks that can be seen by Spitzer’s infrared detectors.

Incredibly, this shock is created about 4 light-years ahead of Kappa Cassiopeiae, showing what a sizable impact this star has on its surroundings. (This is about the same distance that we are from Proxima Centauri, the nearest star beyond the sun.)

The Kappa Cassiopeiae bow shock shows up as a vividly red color. The faint green features in this image result from carbon molecules, called polycyclic aromatic hydrocarbons, in dust clouds along the line of sight that are illuminated by starlight.

Delicate red filaments run through this infrared nebula, crossing the bow shock. Some astronomers have suggested these filaments may be tracing out features of the magnetic field that runs throughout our galaxy. Since magnetic fields are completely invisible themselves, we rely on chance encounters like this to reveal a little of their structure as they interact with the surrounding dust and gas.

Spitzer Space Telescope. Image Credit: NASA/JPL-Caltech

Kappa Cassiopeiae is visible to the naked eye in the Cassiopeia constellation (but its bow shock only shows up in infrared light.)

For this Spitzer image, infrared light at wavelengths of 3.6 and 4.5 microns is rendered in blue, 8.0 microns in green, and 24 microns in red.

NASA's Jet Propulsion Laboratory, Pasadena, Calif., manages the Spitzer Space Telescope mission for NASA's Science Mission Directorate, Washington. Science operations are conducted at the Spitzer Science Center at the California Institute of Technology in Pasadena. Spacecraft operations are based at Lockheed Martin Space Systems Company, Littleton, Colorado. Data are archived at the Infrared Science Archive housed at the Infrared Processing and Analysis Center at Caltech. Caltech manages JPL for NASA. For more information about Spitzer, visit http://spitzer.caltech.edu and http://www.nasa.gov/spitzer

Images (mentioned), Text, Credits: NASA / JPL / Whitney Clavin.

Greetings, Orbiter.ch

How to catch a satellite


ESA - Clean Space logo.

21 February 2014

Standard space dockings are difficult enough, but a future ESA mission plans to capture derelict satellites adrift in orbit. Part of an effort to control space debris, the shopping list of new technologies this ambitious mission requires is set for discussion with industry experts.

Netting a derelict satellite

ESA’s Clean Space initiative is studying the e.DeOrbit mission for removing debris, aiming to reduce the environmental impact of the space industry on Earth and space alike. 

Earth's debris halo

Decades of launches have left Earth surrounded by a halo of space junk: more than 17 000 trackable objects larger than a coffee cup, which threaten working missions with catastrophic collision. Even a 1 cm nut could hit with the force of a hand grenade.

The only way to control the debris population across key low orbits is to remove large items such as derelict satellites and launcher upper stages.

Such uncontrolled multi-tonne items are not only collision risks but also time bombs: they risk exploding due to leftover fuel or partially charged batteries heated up by orbital sunlight.

The resulting debris clouds would make these vital orbits much more hazardous and expensive to use, and follow-on collisions may eventually trigger a chain reaction of break-ups.

Targeting key orbits

e.DeOrbit is designed to target debris items in well-trafficked polar orbits, between 800 km to 1000 km altitude. At around 1600 kg, e.DeOrbit will be launched on ESA’s Vega rocket.

The first technical challenge the mission will face is to capture a massive, drifting object left in an uncertain state, which may well be tumbling rapidly. Sophisticated imaging sensors and advanced autonomous control will be essential, first to assess its condition and then approach it.

Distribution of space debris

Making rendezvous and then steady stationkeeping with the target is hard enough but then comes the really difficult part: how to secure it safely ahead of steering the combined satellite and salvage craft down for a controlled burn-up in the atmosphere?

Several capture mechanisms are being studied in parallel to minimise mission risk. Throw-nets have the advantage of scalability – a large enough net can capture anything, no matter its size and attitude. Tentacles, a clamping mechanism that builds on current berthing and docking mechanisms, could allow the capture of launch adapter rings of various different satellites.

Grabbing a target

Harpoons work no matter the target’s attitude and shape, and do not require close operations. Robotic arms are another option: results from the DLR German space agency's forthcoming DEOS orbital servicing mission will be studied with interest.

Strong drivers for the platform design are not only the large amount of propellant required, but also the possible rapid tumbling of the target – only so much spin can be absorbed without the catcher craft itself going out of control.

Apart from deorbit options based on flexible and rigid connections, techniques are being considered for raising targets to higher orbits, including tethers and  electric propulsion.

A symposium on 6 May in the Netherlands will cover studies and technology developments related to e.DeOrbit, with ESA and space industry representatives presenting their research and outlining their plans. For further information, or to register, go here: http://space-env.esa.int/indico/conferenceDisplay.py?confId=46

Related links:

e.DeOrbit symposium – 6 May 2014 in Noordwijk, the Netherlands: http://space-env.esa.int/indico/conferenceDisplay.py?confId=46

Technologies for space debris remediation: http://www.esa.int/Our_Activities/Space_Engineering/Clean_Space/Technologies_for_space_debris_remediation

DLR DEOS mission (in German): http://www.dlr.de/rd/desktopdefault.aspx/tabid-2266/3398_read-36724/

Images, Text, Credit: European Space Agency (ESA).

Best regards, Orbiter.ch

Proba-2 view of post-eruptive loops on Sun


ESA - Proba-2 Mission logo.

Feb. 21, 2014


ESA’s Sun-watching Proba-2 minisatellite shows the aftermath of 18 February’s ‘coronal mass ejection’.

Acquired at 0445 GMT, a little more than three hours after the initial eruption, the image demonstrates the Sun’s magnetic field reconnecting in the form of loops. Look down and left of the centre of the solar disc to clearly see this distinctive belt of loops.

Coronal mass ejections are powered by energy stored in the magnetic field of the Sun’s corona. This energy that can be released by the process of reconnection, in which oppositely oriented field lines are reconfigured to a more relaxed state and stored magnetic energy is converted into the heat and kinetic energy needed to drive huge outward eruptions.

Fields that have recently reconnected are heated to many millions of degrees, then cooling to the one million degree temperatures that are visible to Proba-2’s SWAP imager. A second Proba-2 sensor, LYRA, measures the Sun’s energy intensity at the same time. Both instruments are operated for ESA by the Royal Observatory of Belgium.

18 February sun CME and its aftermath

All the latest solar images from ESA and NASA are fed to the Helioviewer website, where you can make your own images and animations – see here: http://www.helioviewer.org/

Related links:

ESA - Proba-2: http://www.esa.int/Our_Activities/Technology/Proba_Missions/About_Proba-2

Royal Observatory of Belgium: http://proba2.sidc.be/

Image, Video, Text, Credits: ESA / ROB.

Cheers, Orbiter.ch

jeudi 20 février 2014

Smart SPHERES Are About to Get A Whole Lot Smarter


NASA - Space Robotics logo.

February 20, 2014

Smart devices – such as tablets and phones – increasingly are an essential part of everyday life on Earth. The same can be said for life off-planet aboard the International Space Station. From astronaut tweets to Google+ Hangouts, our reliance on these mobile and social technologies means equipment and software upgrades are an everyday occurrence – like buying a new pair of shoes to replace a pair of well-worn ones.

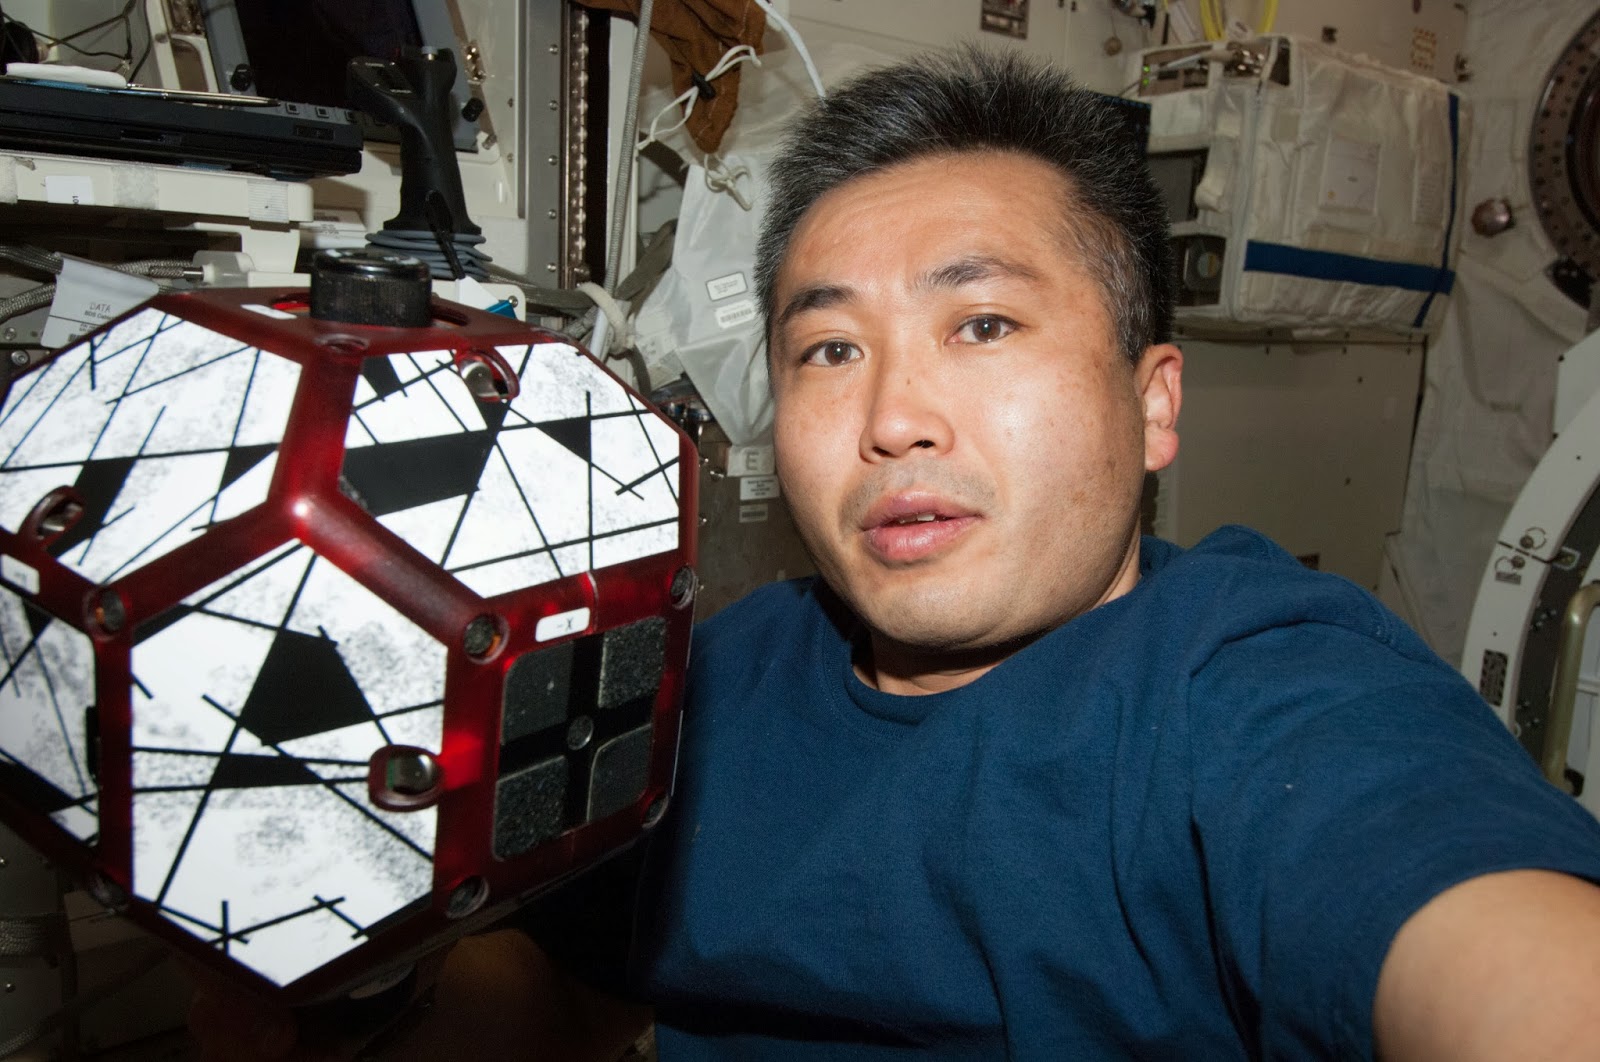
That’s why the Intelligent Robotics Group at NASA’s Ames Research Center in Moffett Field, Calif., with funding from the Technology Demonstration Missions Program in the Space Technology Mission Directorate, is working to upgrade the smartphones currently equipped on a trio of volleyball-sized free-flying satellites on the space station called Synchronized Position Hold, Engage, Reorient, Experimental Satellites (SPHERES). In 2011 on the final flight of space shuttle Atlantis, NASA sent the first smartphone to the station and mounted it to SPHERES.


Image above: Japan Aerospace Exploration Agency astronaut Koichi Wakata, Expedition 38 flight engineer, conducting a session with a pair of bowling-ball-sized free-flying satellites known as Synchronized Position Hold, Engage, Reorient, Experimental Satellites (SPHERES) aboard the International Space Station. Image Credit: NASA.

Each SPHERE satellite is self-contained with power, propulsion, computing and navigation equipment as well as expansion ports for additional sensors and appendages, such as cameras and wireless power transfer systems. This is where the SPHERES' smartphone upgrades are attached.

By connecting a smartphone, the SPHERES become Smart SPHERES. They now are more intelligent because they have built-in cameras to take pictures and video, sensors to help conduct inspections, powerful computing units to make calculations and Wi-Fi connections to transfer data in real time to the computers aboard the space station and at mission control.

"With this latest upgrade, we believe the Smart SPHERES will be a step closer to becoming a ‘mobile assistant' for the astronauts,” said DW Wheeler, lead engineer with SGT Inc. in the Intelligent Robotics Group at Ames. "This ability for Smart SPHERES to independently perform inventory and environmental surveys on the space station can free up time for astronauts and mission control to perform science experiments and other work.”

Later this year, NASA will launch a Project Tango prototype Android smartphone developed by Google’s Advanced Technology and Projects division of Mountain View, Calif. The prototype phone includes an integrated custom 3-D sensor, which means the device is capable of tracking its own position and orientation in real time as well as generating a full 3-D model of the environment.


Image above: NASA astronaut Mike Fossum puts one of the Smart SPHERES through its paces during Expedition 29 aboard the International Space Station. The addition of the smartphone helped turn the SPHERES into mobile data acquisition assistants. Image Credit: NASA.

“The Project Tango prototype incorporates a particularly important feature for the Smart SPHERES – a 3-D sensor,” said Terry Fong, director of the Intelligent Robotics Group at Ames. “This allows the satellites to do a better job of flying around on the space station and understanding where exactly they are.”

Later this month, Ames engineers will fly the prototype phone several times aboard an airplane that is capable of simulating microgravity by performing a parabolic flight path. The team has modified the motion-tracking and positioning code developed by Google that tells the phone where it is to work in the microgravity conditions of the space station. To verify that the phone will work, they must take the phone out of the lab at Ames and test it in a microgravity environment.

The SPHERES facility aboard the space station provides affordable opportunities to test a wide range of hardware and software. It acts as a free-flying platform that can accommodate various mounting features and mechanisms in order to test and examine the physical or mechanical properties of materials in microgravity. SPHERES also provides a test bed for space applications including physical sciences investigations, free-flying spatial analyses, multi-body formation flying and various multi-spacecraft control algorithm verifications and analyses. SPHERES also is used for the annual Zero Robotics student software programming competition. Ames operates and maintains the SPHERES facility, which is funded by the Human Exploration and Operations Mission Directorate at NASA Headquarters in Washington.

To date, astronauts have conducted 77 investigations using SPHERES to test techniques to advance automated dockings, satellite servicing, spacecraft assembly and emergency repairs. Now researchers are preparing to control the SPHERES in real time from ground control stations on Earth and from space.

In the long run, free-flying robots like SPHERES could also be used to inspect the exterior of the space station or future deep space vehicles. Robots like the smartphone-enhanced SPHERES and NASA's Robonaut 2, will provide some of the help of another crew member; SPHERES' cameras can act as another set of eyes, while Robonaut 2 literally adds another set of hands to act as an assistant with small and bulky items alike. An added bonus is that robots do not require any additional life support.


Image above: Humanoid robot “Robonaut 2" in the Destiny laboratory of the International Space Station. Image Credit: NASA.

As with Robonaut 2, all tests to date have occurred in the safety of the space station's interior. However, in the future, upgraded SPHERES may venture outside the orbiting outpost.

“This is no ordinary upgrade – we’ve customized cutting-edge commercial technologies to help us answer questions like: How can robots help humans live and work in space? What will happen when humans explore other worlds with robots by their side? Can we make this happen sooner, rather than later?" said Fong. "Building on our experience in controlling robots on the space station, one day we'll be able to apply what we've learned and have humans and robots working together everywhere from Earth's orbit, to the moon, asteroids and Mars."

Related links:

International Space Station: http://www.nasa.gov/mission_pages/station/main/index.html

Reorient, Experimental Satellites (SPHERES): http://www.nasa.gov/mission_pages/station/research/experiments/128.html

Space Technology Mission Directorate: http://www.nasa.gov/telerobotics

NASA's Robonaut 2: http://www.nasa.gov/robonaut

NASA’s Ames Research Center: http://www.nasa.gov/centers/ames/home/

Images (mentioned), Text, Credits: NASA / Ames Research Center / Rachel Hoover.

Greetings, Orbiter.ch

With A Deadly Embrace, 'Spidery' Pulsars Consume Their Mates


NASA - Fermi Gamma-ray Space Telescope logo.

February 20, 2014

Black widow spiders and their Australian cousins, known as redbacks, are notorious for their tainted love, expressed as an unsettling tendency to kill and devour their male partners. Astronomers have noted similar behavior among two rare breeds of binary system that contain rapidly spinning neutron stars, also known as pulsars.

"The essential features of black widow and redback binaries are that they place a normal but very low-mass star in close proximity to a millisecond pulsar, which has disastrous consequences for the star," said Roger Romani, a member of the Kavli Institute for Particle Astrophysics and Cosmology, an institute run jointly by Stanford and SLAC National Accelerator Laboratory in Menlo Park, Calif. Black widow systems contain stars that are both physically smaller and of much lower mass than those found in redbacks.

So far, astronomers have found at least 18 black widows and nine redbacks within the Milky Way, and additional members of each class have been discovered within the dense globular star clusters that orbit our galaxy.

A Black Widow Pulsar Consumes its Mate

Video above: Learn how astronomers discovered PSR J1311-3430, a record-breaking black widow binary and the first of its kind discovered solely through gamma-ray observations. Image Credit: NASA's Goddard Space Flight Center.

One black widow system, named PSR J1311-3430 and discovered in 2012, sets the record for the tightest orbit of its class and contains one of the heaviest neutron stars known. The pulsar's featherweight companion, which is only a dozen or so times the mass of Jupiter and just 60 percent of its size, completes an orbit every 93 minutes – less time than it takes to watch most movies. Initial estimates put the neutron star at about 2.7 solar masses, but more recent studies allow a range of values extending down to 2 solar masses, still among the highest-known for neutron stars. (Watch the video above to learn more about this system and its discovery from some of the scientists involved.)

When a massive star explodes as a supernova, the crushed core it leaves behind – a neutron star -- squeezes more mass than the sun into a ball no larger than Washington, D.C. When young, an isolated neutron star rotates tens of times each second -- or  a few thousand revolutions per minute -- and generates beams of radio, visible light, X-rays and gamma rays that astronomers observe as pulsed emission whenever the beams sweep past Earth. They also generate powerful outflows, or "winds," of high-energy particles. The power for all this derives from the neutron star's rapidly spinning magnetic field, and over time, as solitary pulsars wind down, their emissions fade.

Thirty-two years ago, astronomers discovered a new, much faster class of pulsars.  With rotation periods of 10 milliseconds or less, these neutron stars spin at astonishing speeds, up to 43,000 rpm. Today, more than 300 of these so-called millisecond pulsars have been cataloged. While young pulsars usually appear in isolation, more than half of millisecond pulsars have a stellar partner, suggesting that interactions with a normal star can rejuvenate an older, slower neutron star. But how did isolated millisecond pulsars get their groove back?

Enter black widows and their kin.

"The high-energy emission and wind from the pulsar basically heats and blows off the normal star's material and, over millions to billions of years, can eat away the entire star," said Alice Harding, an astrophysicist at NASA's Goddard Space Flight Center in Greenbelt, Md. "These systems can completely consume their companion stars, and that's how we think solitary millisecond pulsars form."

NASA's Fermi Gamma-ray Space Telescope excels at locating millisecond pulsars, with more than four dozen found to date. Pulsars stand out as prominent gamma-ray sources to Fermi's Large Area Telescope (LAT), but searching for their pulsations in Fermi data is extraordinarily difficult without knowing more about the system. Follow-up surveys with radio telescopes are usually the first to pick up pulses, providing confirmation that the object is indeed a pulsar. By narrowing down the timing and other parameters, radio studies also enable Fermi scientists to tease out the gamma-ray pulses from LAT data.

"Almost all of the black widows and redbacks known in our galaxy have been detected by Fermi, and more than half were actually discovered by targeting Fermi sources with various radio telescopes," said Mallory Roberts, a researcher for Eureka Scientific, Inc. who is currently a visiting professor at New York University in Abu Dhabi, United Arab Emirates. He has participated in several radio surveys of Fermi sources and led one with the Robert C. Byrd Green Bank Telescope in West Virginia that uncovered five of these systems.

Pulsars emit intense radiation because their rapid rotation and strong magnetic fields accelerate particles to tremendous energies. For astronomers, an exciting aspect of the black widow and redback systems is the opportunity to observe how the stellar companion intercepts energy from the pulsar. In effect, the star serves as a vanity mirror, showing the pulsar's emissions in tremendous detail.

When Romani began investigating the Fermi source now known as PSR J1311-3430 (J1311, for short), he imaged the system in visible light. This revealed a faint star that changed color from an intense blue to a dull red – hot and cold, for stars -- every hour and a half. Romani conjectured that the star was orbiting and being dramatically heated by a compact object, most likely a pulsar, and suggested that the system was a new black widow.


Image above: Spinning 390 times a second, PSR J1311-3430 periodically swings its radio (green) and gamma-ray (magenta) beams past Earth in this artist's concept. The pulsar heats the facing side of its stellar partner to temperatures twice as hot as the sun's surface and slowly evaporates it. Image Credit: NASA's Goddard Space Flight Center.

His measurements indicate that the side of the star facing the pulsar is heated to more than 21,000 degrees Fahrenheit (nearly 12,000 C), or more than twice as hot as the sun's surface. The cool red side reveals the true color of the pipsqueak star, glowing at a temperature of 5,000 F (2,700 C) -- half the sun's surface temperature – or lower.

Simple models used for other black widows assume that the pulsar blowtorch heats its partner uniformly; when applied to J1311, they indicate a very large mass for the neutron star. However, additional observations made in 2013 with the Gemini Telescope in Chile and the Keck Telescope in Hawaii show spectacular flares on the companion, indicating variable heating. This allows somewhat lower pulsar masses down to twice the mass of the sun. Reflecting this adjustment, the companion scales up to between 12 to 17 times the mass of Jupiter.

A search of archival observations with the Green Bank Telescope failed to turn up any radio pulsations, but Holger Pletsch at the Albert Einstein Institute in Hannover, Germany, led an international team on an effort to comb through four years of Fermi LAT data in a search for gamma-ray pulses. The orbital information established by Romani's work significantly narrowed the search, but the unknown pulsar parameters still left 100 million billion combinations to explore. Nevertheless, armed with a new, more efficient method, they detected a clear signal soon after the analysis began.

"This was the first time a millisecond pulsar has ever been detected solely by pulsed gamma rays," Pletsch said. "Seeing this signal was extremely exciting and satisfying for our team, and it's another triumph for Fermi." Spinning at 390 times a second – more than 23,000 rpm -- J1311 rotates on average about a million times between every gamma ray detected by the LAT.

After this discovery, a team led by Paul Ray at the Naval Research Laboratory in Washington took a long look at the system with the Green Bank Telescope and other radio observatories. They found that the system does indeed emit radio pulses, but only during brief, irregular intervals. "The pulsar heating is ablating its companion, literally blowing it away, so ionized gas fills the system, and this scatters or absorbs the radio emission most of the time," Ray said. Higher-energy gamma rays easily punch through the veil.

Black widow and redback binaries offer unique natural laboratories for studying pulsars up close through the disastrous effects on their partners, which are distorted by the neutron star's tidal pull, inflamed by its gamma rays, pummeled with particles accelerated to near the speed of light, and ultimately evaporated in a breakup of cosmic proportions.

Related Links:

Download additional images and HD animation sequences from NASA Goddard's Scientific Visualization Studio: http://svs.gsfc.nasa.gov/goto?11215

Interactive: Fermi Pulsar Explorer: http://www.nasa.gov/externalflash/fermipulsar/

Paper: Radio Detection of the Fermi LAT Blind Search Millisecond Pulsar J1311-3430: http://arxiv.org/abs/1210.6676

Paper: PSR J1311-3430: A Heavyweight Neutron Star with a Flyweight Helium Companion: http://pubman.mpdl.mpg.de/pubman/item/escidoc:1563464:2/component/escidoc:1563463/science.1229054.full.pdf

Paper: Binary Millisecond Pulsar Discovery via Gamma-Ray Pulsations: http://pubman.mpdl.mpg.de/pubman/item/escidoc:1563464:2/component/escidoc:1563463/science.1229054.full.pdf

Paper: 2FGL J1311.7-3429 Joins the Black Widow Club: http://iopscience.iop.org/2041-8205/754/2/L25/pdf/2041-8205_754_2_L25.pdf

List of rotation- and accretion-powered millisecond pulsars: http://apatruno.wordpress.com/about/millisecond-pulsar-catalogue/

"NASA's Fermi Finds Youngest Millisecond Pulsar, 100 Pulsars To-Date" (11.03.11): http://orbiterchspacenews.blogspot.ch/2011/11/nasas-fermi-finds-youngest-millisecond.html

Images (mentioned), Video (mentioned), Text, Credits: NASA's Goddard Space Flight Center / Francis Reddy.

Best regards, Orbiter.ch

mercredi 19 février 2014

Curiosity Adds Reverse Driving for Wheel Protection


NASA - Mars Science Laboratory (MSL) logo.

February 19, 2014

Map of Recent and Planned Driving by Curiosity as of Feb. 18, 2014

Image above: This map shows the route driven and route planned for NASA's Curiosity Mars rover from before reaching "Dingo Gap" -- in upper right -- to the mission's next science waypoint, "Kimberley" (formerly referred to as "KMS-9") -- in lower left. Image Credit: NASA/JPL-Caltech/Univ. of Arizona.

Terrain that NASA's Curiosity Mars rover is now crossing is as smooth as team members had anticipated based on earlier images from orbit.

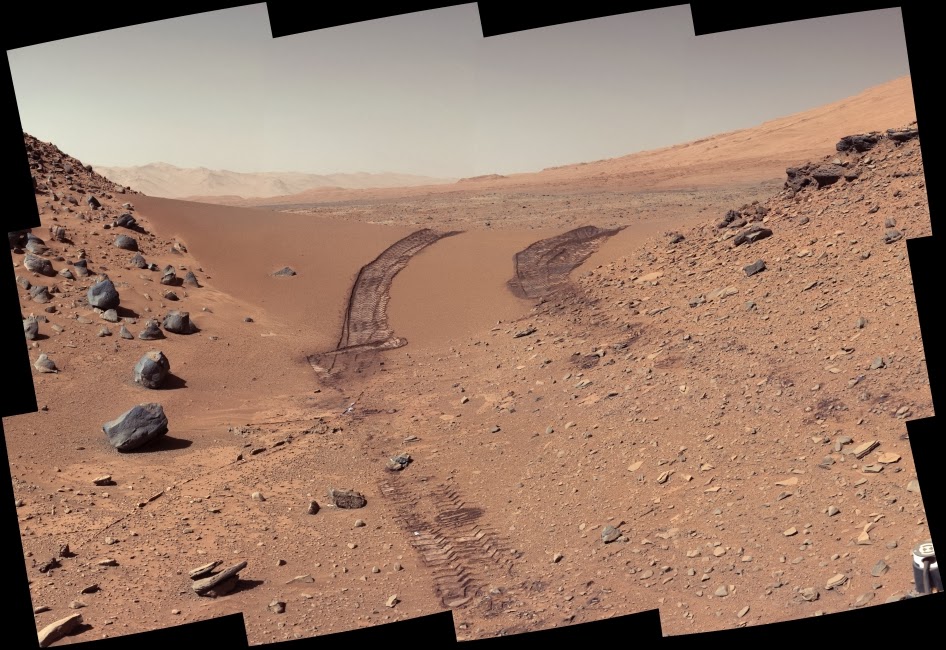
On Tuesday, Feb. 18, the rover covered 329 feet (100.3 meters), the mission's first long trek that used reverse driving and its farthest one-day advance of any kind in more than three months.

The reverse drive validated feasibility of a technique developed with testing on Earth to lessen damage to Curiosity's wheels when driving over terrain studded with sharp rocks. However, Tuesday's drive took the rover over more benign ground.

"We wanted to have backwards driving in our validated toolkit because there will be parts of our route that will be more challenging," said Curiosity Project Manager Jim Erickson of NASA's Jet Propulsion Laboratory, Pasadena, Calif.

Curiosity Mars Rover's Shadow After Long Backward Drive

Image above: NASA's Curiosity Mars rover caught its own shadow in this image taken just after completing a drive of 329 feet (100.3 meters) on the 547th Martian day, or sol, of the rover's work on Mars (Feb. 18, 2014). Image Credit: NASA/JPL-Caltech.

The rover team used images taken from orbit to reassess possible routes, after detecting in late 2013 that holes in the vehicle's aluminum wheels were accumulating faster than anticipated. Getting to the chosen route, which appeared to be less hazardous for the wheels, required crossing a 3-foot-tall (1-meter-tall) dune. Curiosity crossed the dune on Feb. 9.

Erickson said, "After we got over the dune, we began driving in terrain that looks like what we expected based on the orbital data. There are fewer sharp rocks, many of them are loose, and in most places there's a little bit of sand cushioning the vehicle."

The mission's destinations remain the same: a science waypoint first and then the long-term goal of investigating the lower slopes of Mount Sharp, where water-related minerals have been detected from orbit.

The science waypoint, which may be where Curiosity next uses its sample-collecting drill, is an intersection of different rock layers about two-thirds of a mile (about 1.1 kilometers) ahead on the planned route. This location, formerly called KMS-9 from when it was one of many waypoint candidates, is now called "Kimberley," for the geological mapping quadrant that contains it. The mapping quadrant was named for the northwestern Australia region with very old rocks.

Curiosity's Color View of Martian Dune After Crossing It

Image above: This look back at a dune that NASA's Curiosity Mars rover drove across was taken by the rover's Mast Camera (Mastcam) during the 538th Martian day, or sol, of Curiosity's work on Mars (Feb. 9,2004). Image Credit: NASA/JPL-Caltech/MSSS.

While the rover is headed for the Kimberley waypoint and during the time it spends doing science investigations there, the team will use orbital imagery to choose a path for continuing toward the long-term destination.

"We have changed our focus to look at the big picture for getting to the slopes of Mount Sharp, assessing different potential routes and different entry points to the destination area," Erickson said. "No route will be perfect; we need to figure out the best of the imperfect ones."

Curiosity has driven 937 feet (285.5 meters) since the Feb. 9 dune-crossing, for a total odometry of 3.24 miles (5.21 kilometers) since its August 2012 landing.

NASA's Mars Science Laboratory Project is using Curiosity to assess ancient habitable environments and major changes in Martian environmental conditions.  JPL, a division of the California Institute of Technology in Pasadena, built the rover and manages the project for NASA's Science Mission Directorate in Washington.  For more information about Curiosity, visit http://www.nasa.gov/msl and http://mars.jpl.nasa.gov/msl/. You can follow the mission on Facebook at http://www.facebook.com/marscuriosity and on Twitter at: http://www.twitter.com/marscuriosity.

Images (mentioned), Text, Credits: NASA / JPL / Guy Webster.

Best regards, Orbiter.ch

NASA Mars Orbiter Views Opportunity Rover on Ridge


NASA - Mars Reconnaissance Orbiter (MRO) patch / NASA - Mars Science Laboratory (MSL) patch.

February 19, 2014

Opportunity Rover on 'Murray Ridge' Seen From Orbit

Image above: The High Resolution Imaging Science Experiment (HiRISE) camera on NASA's Mars Reconnaissance Orbiter caught this view of NASA's Mars Exploration Rover Opportunity on Feb. 14, 2014. The red arrow points to Opportunity at the center of the image.

A new image from a telescopic camera orbiting Mars shows NASA's Mars Exploration Rover Opportunity at work on "Murray Ridge," without any new impact craters nearby.

The Feb. 14 view from the High Resolution Imaging Science Experiment (HiRISE) camera on NASA's Mars Reconnaissance Orbiter is available online at http://www.jpl.nasa.gov/spaceimages/details.php?id=PIA17941.  Rover tracks from Opportunity, as well as the rover itself, are visible.

A rock, dubbed "Pinnacle Island," appeared in January 2014 next to Opportunity where it had been absent a few days earlier. After that, researchers using HiRISE planned this observation to check the remote possibility that a fresh impact by an object from space might have excavated a crater near Opportunity and thrown this rock to its new location. No fresh impact site is seen in the image. Meanwhile, observations by the rover solved the Pinnacle Island mystery by finding where the rock had been struck, broken and moved by a rover wheel.

Murray Ridge is part of the western rim of Endeavour Crater, an impact scar that is billions of years old and about 14 miles (22 kilometers) in diameter.

NASA's Jet Propulsion Laboratory, a division of the California Institute of Technology in Pasadena, manages the Opportunity mission for NASA's Science Mission Directorate, Washington.

For more information about Opportunity, visit http://www.nasa.gov/rovers and http://marsrovers.jpl.nasa.gov
 
For more information about Mars Reconnaissance Orbiter (MRO), visit: http://mars.jpl.nasa.gov/mro/

Image, Text, Credit: NASA / JPL-Caltech / Univ. of Arizona.

Cheers, Orbiter.ch

RXTE Reveals the Cloudy Cores of Active Galaxies


NASA - Rossi X-ray Timing Explorer (RXTE) patch.

February 19, 2014

Picture a single cloud large enough to span the solar system from the sun to beyond Pluto's orbit. Now imagine many such clouds orbiting in a vast ring at the heart of a distant galaxy, occasionally dimming the X-ray light produced by the galaxy's monster black hole.

Using data from NASA's Rossi X-ray Timing Explorer (RXTE) satellite, an international team has uncovered a dozen instances where X-ray signals from active galaxies dimmed as a result of a cloud of gas moving across our line of sight. The new study triples the number of cloud events previously identified in the 16-year archive.

The Cloudy Cores of Active Galaxies

Video above: Zoom into the cloudy heart of an active galaxy. This animation shows an artist's rendition of the cloudy structure revealed by a study of data from NASA's Rossi X-Ray Timing Explorer satellite. Image Credit: NASA's Goddard Space Flight Center/Wolfgang Steffen, UNAM.

At the hearts of most big galaxies, including our own Milky Way, there lurks a supermassive black hole weighing millions to billions of times the sun's mass. As gas falls toward a black hole, it gathers into a so-called accretion disk and becomes compressed and heated, ultimately emitting X-rays. The centers of some galaxies produce unusually powerful emission that exceeds the sun's energy output by billions of times. These are active galactic nuclei, or AGN.

"One of the great unanswered questions about AGN is how gas thousands of light-years away funnels into the hot accretion disk that feeds the supermassive black hole," said Alex Markowitz, an astrophysicist at the University of California, San Diego and the Karl Remeis Observatory in Bamberg, Germany. "Understanding the size, shape and number of clouds far from the black hole will give us a better idea of how this transport mechanism operates."

Rossi X-ray Timing Explorer (RXTE) spacecraft

The study is the first statistical survey of the environments around supermassive black holes and is the longest-running AGN-monitoring study yet performed in X-rays. In the paper, which will appear in a future issue of Monthly Notices of the Royal Astronomical Society and is now published online, the scientists describe various properties of the occulting clouds, which vary in size and shape but average 4 billion miles (6.5 billion km) across – greater than Pluto's distance from the sun -- and twice the mass of Earth. They orbit a few light-weeks to a few light-years from the black hole.

RXTE's instruments measured variations in X-ray emission on timescales as short as microseconds and as long as years across a wide energy span, from 2,000 to 250,000 electron volts. For comparison, the energy of a typical dental X-ray is around 60,000 electron volts. NASA decommissioned the observatory in 2012, following 16 years of successful operation in Earth orbit.

"Because RXTE performed sustained observations of many of these AGN, our research is sensitive to a wide range of cloud events, from those as brief as five hours to as long as 16 years," said co-author Robert Nikutta, a theorist at Andrés Bello University in Santiago, Chile.

For decades, astronomers explained the different observed properties of AGN by suggesting that a relatively uniform "doughnut" of dust and gas surrounds the black hole and extends several light-years away from it. Interference from this material is lowest when we happen to be looking into the doughnut from above or below and greatest when we view it from the side. Now astronomers are moving toward a new generation of models that view the doughnut as a collection of many individual clouds mostly distributed along its central plane, a view supported by the RXTE study.

One of the more unusual events the team turned up occurred in NGC 3783, a barred spiral galaxy located 143 million light-years away toward the constellation Centaurus. "In 2008, the AGN dimmed twice over a period of 11 days and did not reach its typical X-ray brightness within that period," said co-author Mirko Krumpe of the European Southern Observatory in Garching, Germany. "This could be caused by an elongated, filamentary cloud, perhaps one that is in the process of being torn apart by the black hole."

Related Links:

Download HD video from NASA Goddard's Scientific Visualization Studio: http://svs.gsfc.nasa.gov/goto?11482

Paper: First X-ray-Based Statistical Tests for Clumpy-Torus Models: Eclipse Events from 230 Years of Monitoring of Seyfert AGN: http://mnras.oxfordjournals.org/lookup/doi/10.1093/mnras/stt2492

More about the Rossi X-Ray Timing Explorer: https://heasarc.gsfc.nasa.gov/docs/xte/XTE.html

"NASA's Rossi X-Ray Timing Explorer Completes Mission Operations" (01.09.12): http://orbiterchspacenews.blogspot.ch/2012/01/nasas-rossi-x-ray-timing-explorer.html

Active Galaxies and Quasars: Imagine the Universe!: http://imagine.gsfc.nasa.gov/docs/science/know_l2/active_galaxies.html

"X-ray 'Echoes' Map a Supermassive Black Hole's Environs" (05.31.12): http://www.nasa.gov/topics/universe/features/xray-echo.html

"Nearby Galaxy Boasts Two Monster Black Holes, Both Active" (06.10.11): http://orbiterchspacenews.blogspot.ch/2011/06/nearby-galaxy-boasts-two-monster-black.html

Science in the Media Curriculum: Black Holes and Active Galaxies: http://globalastro.gsfc.nasa.gov/?page_id=3548

Image, Video (mentioned), Text, Credits: NASA's Goddard Space Flight Center / Francis Reddy.

Greetings, Orbiter.ch

NASA's NuSTAR Untangles Mystery of How Stars Explode


NASA - NuStar Mission patch.

February 19, 2014

 Sloshing Star Goes Supernova

Video above: NuSTAR is showing that exploding stars slosh around before blasting apart.This 3-D computer simulation demonstrates how the supernova explosion might look. Video Credit: NASA/JPL-Caltech.

One of the biggest mysteries in astronomy, how stars blow up in supernova explosions, finally is being unraveled with the help of NASA's Nuclear Spectroscopic Telescope Array (NuSTAR).

The high-energy X-ray observatory has created the first map of radioactive material in a supernova remnant. The results, from a remnant named Cassiopeia A (Cas A), reveal how shock waves likely rip massive dying stars apart.

Radioactive Core of a Dead Star

Image above: NASA's Nuclear Spectroscope Telescope Array, or NuSTAR, has, for the first time, imaged the radioactive "guts" of a supernova remnant, the leftover remains of a star that exploded. The NuSTAR data are blue, and show high-energy X-rays. Yellow shows non-radioactive material detected previously by NASA's Chandra X-ray Observatory in low-energy X-rays. Image credit: NASA/JPL-Caltech/CXC/SAO.

"Stars are spherical balls of gas, and so you might think that when they end their lives and explode, that explosion would look like a uniform ball expanding out with great power," said Fiona Harrison, the principal investigator of NuSTAR at the California Institute of Technology (Caltech) in Pasadena. "Our new results show how the explosion's heart, or engine, is distorted, possibly because the inner regions literally slosh around before detonating."

Harrison is a co-author of a paper about the results appearing in the Feb. 20 issue of Nature.

The Case of Missing Iron in Cassiopeia A

Image above: When astronomers first looked at images of a supernova remnant called Cassiopeia A, captured by NASA's Nuclear Spectroscopic Telescope Array, or NuSTAR, they were shocked. What they saw didn't match previous observations. The mystery of Cassiopeia A (Cas A), a massive star that exploded in a supernova more than 11,000 years ago, continues to confound researchers. Image credit: NASA/JPL-Caltech/CXC/SAO.

Cas A was created when a massive star blew up as a supernova leaving a dense stellar corpse and its ejected remains. The light from the explosion reached Earth a few hundred years ago, so we are seeing the stellar remnant when it was fresh and young.

Supernovas seed the universe with many elements, including the gold in jewelry, the calcium in bones and the iron in blood. While small stars like our sun die less violent deaths, stars at least eight times as massive as our sun blow up in supernova explosions. The high temperatures and particles created in the blast fuse light elements together to create heavier elements.

NuSTAR Data Point to Sloshing Supernovas

Images above: How massive stars blow up in powerful explosions called supernovas remains a mystery. Theorists have come up with computer simulations to try to recreate what happens, but it's not clear which model is correct. Now, new observations from NASA's Nuclear Spectroscopic Telescope Array of the heart of the Cassiopeia supernova remnant are allowing researchers to test those models with real evidence. Image credit: NASA/JPL-Caltech/CXC/SAO/SkyWorks Digital/Christian Ott.

NuSTAR is the first telescope capable of producing maps of radioactive elements in supernova remnants. In this case, the element is titanium-44, which has an unstable nucleus produced at the heart of the exploding star.


Image above: These illustrations show the progression of a supernova blast. A massive star (left), which has created elements as heavy as iron in its interior, blows up in a tremendous explosion (middle), scattering its outer layers in a structure called a supernova remnant (right). Image Credit: NASA/CXC/SAO/JPL-Caltech.

The NuSTAR map of Cas A shows the titanium concentrated in clumps at the remnant's center and points to a possible solution to the mystery of how the star met its demise. When researchers simulate supernova blasts with computers, as a massive star dies and collapses, the main shock wave often stalls out and the star fails to shatter.

The latest findings strongly suggest the exploding star literally sloshed around, re-energizing the stalled shock wave and allowing the star to finally blast off its outer layers.


Image above: Artist's concept of NuSTAR on orbit. NuSTAR has a 10-m (30') mast that deploys after launch to separate the optics modules (right) from the detectors in the focal plane (left). Image Credit: NASA/JPL-Caltech.

"With NuSTAR we have a new forensic tool to investigate the explosion," said the paper's lead author, Brian Grefenstette of Caltech. "Previously, it was hard to interpret what was going on in Cas A because the material that we could see only glows in X-rays when it's heated up. Now that we can see the radioactive material, which glows in X-rays no matter what, we are getting a more complete picture of what was going on at core of the explosion."

The NuSTAR map also casts doubt on other models of supernova explosions, in which the star is rapidly rotating just before it dies and launches narrow streams of gas that drive the stellar blast. Though imprints of jets have been seen before around Cas A, it was not known if they were triggering the explosion. NuSTAR did not see the titanium, essentially the radioactive ash from the explosion, in narrow regions matching the jets, so the jets were not the explosive trigger.

Untangling the Remains of Cassiopeia A

Image above: The mystery of how Cassiopeia A exploded is unraveling thanks to new data from NASA's Nuclear Spectroscopic Telescope Array, or NuSTAR. In this image, NuSTAR data, which show high-energy X-rays from radioactive material, are colored blue. Lower-energy X-rays from non-radioactive material, imaged previously with NASA's Chandra X-ray Observatory, are shown in red, yellow and green. Image credit: NASA/JPL-Caltech/CXC/SAO.

"This is why we built NuSTAR," said Paul Hertz, director of NASA's astrophysics division in Washington. "To discover things we never knew – and did not expect – about the high-energy universe."

The researchers will continue to investigate the case of Cas A's dramatic explosion. Centuries after its death marked our skies, this supernova remnant continues to perplex.

For more information about NuSTAR and images, visit: http://www.nasa.gov/nustar

Images (mentioned), Text, Credits: NASA / J.D. Harrington / JPL / Whitney Clavin.

Best regards, Orbiter.ch

Martian Dunes Flying in Formation


NASA - Mars Reconnaissance Orbiter (MRO) logo.

Feb. 19, 2014

Dunes Flying in Formation

Migratory birds and military aircraft often fly in a V-shaped formation. The “V” formation greatly boosts the efficiency and range of flying birds, because all except the first fly in the upward motion of air -- called upwash -- from the wingtip vortices of the bird ahead.

In this image of a dune field on Mars in a large crater near Mawrth Vallis, some of the dunes appear to be in a V-shaped formation. For dune fields, the spacing of individual dunes is a function of sand supply, wind speed, and topography.

 Martian Dunes Flying in Formation

This image was acquired by the HiRISE camera aboard NASA's Mars Reconnaissance Orbiter on Dec. 30, 2013. The University of Arizona, Tucson, operates the HiRISE camera, which was built by Ball Aerospace & Technologies Corp., Boulder, Colo. NASA's Jet Propulsion Laboratory, a division of the California Institute of Technology in Pasadena, manages the Mars Reconnaissance Orbiter Project for the NASA Science Mission Directorate, Washington.

For more information about Mars Reconnaissance Orbiter (MRO), visit: http://mars.jpl.nasa.gov/mro/

More information and image products: http://www.uahirise.org/ESP_034815_2035

Image, Video, Text, Credits:  Credit: NASA / JPL-Caltech/ Univ. of Arizona / Caption: Alfred McEwen.

Greetings, Orbiter.ch

Hubble Watches Stars' Clockwork Motion In Nearby Galaxy


NASA - Hubble Space Telescope patch.

February 19, 2014


Image above: This artist’s illustration shows Hubble measurements of the rotation of the Large Magellanic Cloud (LMC), the nearest normal-sized galaxy to our Milky Way. The LMC appears in the southern-hemisphere night sky, as seen in this ground-based image. Image Credit: NASA/ESA.

Using the sharp-eyed NASA Hubble Space Telescope, astronomers have for the first time precisely measured the rotation rate of a galaxy based on the clock-like movement of its stars.

According to their analysis, the central part of the neighboring galaxy, called the Large Magellanic Cloud (LMC), completes a rotation every 250 million years. It takes our sun the same amount of time to complete a rotation around the center of our Milky Way galaxy.

The Hubble team -- Roeland van der Marel of the Space Telescope Science Institute in Baltimore, Md., and Nitya Kallivayalil of the University of Virginia in Charlottesville, Va. -- used Hubble to measure the average motion of hundreds of individual stars in the LMC, located 170,000 light-years away. Hubble recorded the stars' slight movements during a seven-year period.

"Studying this nearby galaxy by tracking the stars' movements gives us a better understanding of the internal structure of disk galaxies," said Kallivayalil, "Knowing a galaxy's rotation rate offers insight into how a galaxy formed, and it can be used to calculate its mass."

Disk-shaped galaxies such as the Milky Way and the LMC generally rotate like a carousel. Hubble's precision tracking offers a new way to determine a galaxy's rotation by the "sideways" proper motion of its stars, as seen in the plane of the sky. Astronomers have long measured the sideways motions of nearby celestial objects, but this is the first time the precision has become sufficient to see another distant galaxy rotate.

"The LMC is a very important galaxy because it is very near to our Milky Way," said van der Marel, who is the lead author on a paper in the Feb. 1 issue of the Astrophysical Journal. "Studying the Milky Way is difficult because you're studying from the inside, so everything you see is spread all over the sky. It's all at different distances, and you're sitting in the middle of it. Studying structure and rotation is much easier if you view a nearby galaxy from the outside."

For the past century, astronomers have calculated galaxy rotation rates by observing a slight shift in the spectrum of its starlight. This shift is known as the Doppler Effect. On one side of a galaxy's spinning stellar disk, the stars swinging in the direction of Earth will show a spectral blueshift -- the compression of light waves due to motion toward the observer. Stars swinging away from Earth on the opposite side of a galaxy will show a spectral redshift -- the stretching of light to redder wavelengths due to motion away from the observer.

The newly measured Hubble motions and the Doppler motions measured previously provide complementary information about the LMC's rotation rate. By combining the results, the Hubble team obtained a fully three-dimensional view of stellar motions in another galaxy.

"By using Hubble to study the stars' motions over several years, we can actually, for the first time, see a galaxy rotate in the plane of the sky," said van der Marel.

Hubble is the only telescope that can make this kind of observation because of its sharp resolution, its image stability, and its 24 years in space.

Hubble Space Telescope. Image Credits: NASA / ESA.

"If we imagine a human on the moon, Hubble's precision would allow us to determine the speed at which the person's hair grows," van der Marel explained. "This precision is crucial, because the apparent stellar motions are so small because of the galaxy's distance. You can think of the LMC as a clock in the sky, on which the hands take 250 million years to make one revolution. We know the clock's hands move, but even with Hubble we need to stare at them for several years to see any movement."

The research team used Hubble's Wide Field Camera 3 and Advanced Camera for Surveys to observe stars in 22 fields spread across the vast disk of the LMC, which appears in the southern night sky as an object about 20 times the diameter of the moon. Arrows on the accompanying image show the predicted motion over the next 7 million years, based on the Hubble measurements.

Each observed field contains not only dozens of LMC stars, but also a background quasar, a brilliant beacon of light powered by a black hole in the core of the distant active galaxy. The astronomers used the quasars as fixed reference points to measure the subtle motion of the LMC stars.

This measurement is the culmination of ongoing work with Hubble to refine the calculation of the LMC's rotation rate. Van der Marel began analyzing the galaxy's rotation in 2002 by creating detailed predictions, now confirmed by Hubble, of what the rotation should look like.

"Because the LMC is nearby, it is a benchmark for studies of stellar evolution and populations," Kallivayalil said. "For this, it's important to understand the galaxy's structure. Our technique for measuring the galaxy's rotation rate using fully three-dimensional motions is a new way to shed light on that structure. It opens a new window to our understanding of how stars in galaxies move."

The team next plans to use Hubble to measure the stellar motions in the LMC's diminutive cousin, the Small Magellanic Cloud, using the same technique. The galaxies are interacting, and that study should also yield improved insight into how the galaxies are moving around each other and around the Milky Way.

Notes:

The Hubble Space Telescope is a project of international cooperation between ESA and NASA.

For a graphic and video illustration of these results, visit: http://hubblesite.org/news/2014/11

For more information about NASA's & ESA's Hubble Space Telescope, visit: http://www.nasa.gov/hubble and http://www.spacetelescope.org/

Images (mentioned), Text, Credits: NASA / J.D. Harrington / Space Telescope Science Institute / Donna Weaver / Ray Villard.

Cheers, Orbiter.ch
Diamonds in the Tail of the Scorpion


ESO - European Southern Observatory logo.

19 February 2014

New ESO image of star cluster Messier 7

The star cluster Messier 7

A new image from ESO’s La Silla Observatory in Chile shows the bright star cluster Messier 7. Easily spotted with the naked eye close to the tail of the constellation of Scorpius, it is one of the most prominent open clusters of stars in the sky — making it an important astronomical research target.

Messier 7, also known as NGC 6475, is a brilliant cluster of about 100 stars located some 800 light-years from Earth. In this new picture from the Wide Field Imager on the MPG/ESO 2.2-metre telescope it stands out against a very rich background of hundreds of thousands of fainter stars, in the direction of the centre of the Milky Way.

The bright star cluster Messier 7 in the constellation of Scorpius

At about 200 million years old, Messier 7 is a typical middle-aged open cluster, spanning a region of space about 25 light-years across. As they age, the brightest stars in the picture — a population of up to a tenth of the total stars in the cluster — will violently explode as supernovae. Looking further into the future, the remaining faint stars, which are much more numerous, will slowly drift apart until they become no longer recognisable as a cluster.

Open star clusters like Messier 7 are groups of stars born at almost the same time and place, from large cosmic clouds of gas and dust in their host galaxy. These groups of stars are of great interest to scientists, because the stars in them have about the same age and chemical composition. This makes them invaluable for studying stellar structure and evolution.

Zooming in on the bright star cluster Messier 7

An interesting feature in this image is that, although densely populated with stars, the background is not uniform and is noticeably streaked with dust. This is most likely to be just a chance alignment of the cluster and the dust clouds. Although it is tempting to speculate that these dark shreds are the remnants of the cloud from which the cluster formed, the Milky Way will have made nearly one full rotation during the life of this star cluster, with a lot of reorganisation of the stars and dust as a result. So the dust and gas from which Messier 7 formed, and the star cluster itself, will have gone their separate ways long ago.

Panning across the bright star cluster Messier 7

The first to mention this star cluster was the mathematician and astronomer Claudius Ptolemy, as early as 130 AD, who described it as a “nebula following the sting of Scorpius”, an accurate description given that, to the naked eye, it appears as a diffuse luminous patch against the bright background of the Milky Way. In his honour, Messier 7 is sometimes called Ptolemy’s Cluster. In 1764 Charles Messier included it as the seventh entry in his Messier catalogue. Later, in the 19th century, John Herschel described the appearance of this object as seen through a telescope as a “coarsely scattered cluster of stars” — which sums it up perfectly.

More information:

ESO is the foremost intergovernmental astronomy organisation in Europe and the world’s most productive ground-based astronomical observatory by far. It is supported by 15 countries: Austria, Belgium, Brazil, the Czech Republic, Denmark, France, Finland, Germany, Italy, the Netherlands, Portugal, Spain, Sweden, Switzerland and the United Kingdom. ESO carries out an ambitious programme focused on the design, construction and operation of powerful ground-based observing facilities enabling astronomers to make important scientific discoveries. ESO also plays a leading role in promoting and organising cooperation in astronomical research. ESO operates three unique world-class observing sites in Chile: La Silla, Paranal and Chajnantor. At Paranal, ESO operates the Very Large Telescope, the world’s most advanced visible-light astronomical observatory and two survey telescopes. VISTA works in the infrared and is the world’s largest survey telescope and the VLT Survey Telescope is the largest telescope designed to exclusively survey the skies in visible light. ESO is the European partner of a revolutionary astronomical telescope ALMA, the largest astronomical project in existence. ESO is currently planning the 39-metre European Extremely Large optical/near-infrared Telescope, the E-ELT, which will become “the world’s biggest eye on the sky”.

Links:

Photos of the MPG/ESO 2.2-metre telescope: http://www.eso.org/public/images/archive/search/?adv=&subject_name=mpg

Photos from the MPG/ESO 2.2-metre telescope: http://www.eso.org/public/images/archive/search/?adv=&facility=15

Photos of La Silla: http://www.eso.org/public/images/archive/category/lasilla/

Images, Text, Credits: ESO / IAU and Sky & Telescope / Videos: ESO / Nick Risinger (skysurvey.org) Music: movetwo.

Greetings, Orbiter.ch

mardi 18 février 2014

Cassini Images Terrain of Saturn's Moon Dione


NASA / ESA - Cassini International logo.

Feb. 18, 2014

The Wisps of Dione

Although the crack-like features seen here on Dione’s surface appear wispy and faded, they are in reality a series of geologically fresh fractures!

See PIA10560 to learn more about Dione's wispy terrain: http://photojournal.jpl.nasa.gov/catalog/PIA10560

Lit terrain seen here is on the trailing hemisphere of Dione. North on Dione (698 miles, or 1,123 kilometers across) is up and rotated 29 degrees to the left.  The image was taken in visible light with the Cassini spacecraft narrow-angle camera on Sept. 10, 2013.

The view was acquired at a distance of approximately 554,000 miles (892,000 kilometers) from Dione. Image scale is three miles (five kilometers) per pixel.

At Carthage Linea

Image above: Dione's icy surface is scarred by craters and sliced up by multiple generations of geologically-young bright fractures. Numerous fine, roughly-parallel linear grooves run across the terrain in the upper left corner. Image Credit: NASA/JPL/Space Science Institute.

Most of the craters seen here have bright walls and dark deposits of material on their floors. As on other Saturnian moons, rockslides on Dione (1,126 kilometers, or 700 miles across) may reveal cleaner ice, while the darker materials accumulate in areas of lower topography and lower slope (e.g. crater floors and the bases of scarps).

The terrain seen here is centered at 15.4 degrees north latitude, 330.3 degrees west longitude, in a region called Carthage Linea. North on Dione is up and rotated 50 degrees to the left.

The image was taken in visible green light with the Cassini narrow-angle camera on Oct. 11, 2005, at a distance of approximately 19,600 kilometers (12,200 miles) from Dione. The image scale is about 230 meters (760 feet) per pixel.

The Cassini-Huygens mission is a cooperative project of NASA, the European Space Agency and the Italian Space Agency. The Jet Propulsion Laboratory, a division of the California Institute of Technology in Pasadena, manages the mission for NASA's Science Mission Directorate, Washington, D.C. The Cassini orbiter and its two onboard cameras were designed, developed and assembled at JPL. The imaging operations center is based at the Space Science Institute in Boulder, Colo.

For more information about the Cassini-Huygens mission visit http://saturn.jpl.nasa.gov . The Cassini imaging team homepage is at http://ciclops.org and http://www.esa.int/Our_Activities/Space_Science/Cassini-Huygens

Image (mentioned), Text, Credits: Credit: NASA / JPL-Caltech / Space Science Institute.

Best regards, Orbiter.ch