vendredi 18 juillet 2014

Space radio telescope Spektr-R - three years of successful work in orbit


ROSCOSMOS - Spektr-R logo.

07/18/2014

July 18, 2011 at 6:31 MSK with the 45th site Baikonur launch pad launch vehicle Zenit-3M upper stage "Fregat-SB" and Russian astrophysical observatory Spektr-R.

Today marks three years since its launch into orbit. During this time, experts NPO. Lavochkin, Astro Space Center of Lebedev Physical Institute. Lebedev RAS (ASC LPI), Space Research Institute and many other scientific organizations has done much research work.

Space radio telescope Spektr-R

Spacecraft Spektr-R, created in the NPO. Lavochkin on the platform Navigator, is the main part of the project Radioastron and is working on a highly elliptical orbit that allows it to ensure the creation of the longest radiointerferometric base today.

Space very long baseline radio interferometry (VLBI) mission Radioastron to detect and investigate objects of cosmic radiation with the highest angular resolution and build their image.

Related link:

(In Russian) Международный проект "Радиоастрон" - International project "Radioastron": http://www.federalspace.ru/319/

ROSCOSMOS Press Realese: http://www.federalspace.ru/20778/

Image, Text, Credits: Roscosmos press service / ROSCOSMOS / Translation: Orbiter.ch Aerospace.

Best regards, Orbiter.ch

A New Look at the Apollo 11 Landing Site


NASA - Lunar Reconnaissance Orbiter (LRO) patch / NASA - Apollo 11 Mission patch.

July 18, 2014

Apollo 11 landed on the Moon on July 20th, 1969, a little after 4:00 in the afternoon Eastern Daylight Time. The Lunar Module, nicknamed Eagle and flown by Neil Armstrong and Edwin "Buzz" Aldrin, touched down near the southern rim of the Sea of Tranquility, one of the large, dark basins that contribute to the Man in the Moon visible from Earth. Armstrong and Aldrin spent about two hours outside the LM setting up experiments and collecting samples.

A New Look at the Apollo 11 Landing Site

At one point, Armstrong ventured east of the LM to examine a small crater, dubbed Little West, that he'd flown over just before landing. The trails of disturbed regolith created by the astronauts' boots are still clearly visible in photographs of the landing site taken by the Lunar Reconnaissance Orbiter (LRO) narrow-angle camera (LROC) more than four decades later.

LROC imagery makes it possible to visit the landing site in a whole new way by flying around a three-dimensional model of the site. LROC scientists created the digital elevation model using a stereo pair of images.

Each image in the pair shows the site from a slightly different angle, allowing sophisticated software to infer the shape of the terrain, similar to the way that left and right eye views are combined in the brain to produce the perception of depth. The animator draped an LROC photograph over the terrain model. He also added a 3D model of the LM descent stage—the real LM in the photograph looks oddly flat when viewed at an oblique angle.

Apollo 11 landing site. Image Credit: Wikipedia

Although the area around the site is relatively flat by lunar standards, West Crater (the big brother of the crater visited by Armstrong) appears in dramatic relief near the eastern edge of the terrain model.

Ejecta from West comprises the boulders that Armstrong had to avoid as he searched for a safe landing site. Apollo 11 was the first of six increasingly ambitious crewed lunar landings.

Lunar Reconnaissance Orbiter (LRO) spacecraft. Image Credit: NASA

The exploration of the lunar surface by the Apollo astronauts, when combined with the wealth of remote sensing data now being returned by LRO, continues to inform our understanding of our nearest neighbor in space.

For more information about Lunar Reconnaissance Orbiter (LRO), visit: http://www.nasa.gov/mission_pages/LRO/main/

For more information about Apollo 11 Mission, visit: http://www.nasa.gov/mission_pages/apollo/missions/apollo11.html

Images (mentioned), Video, Text, Credits: NASA's Goddard Space Flight Center.

Cheers, Orbiter.ch

OCO-2 Data to Lead Scientists Forward into the Past


NASA - OCO-2 Mission logo.

July 18, 2014

NASA's Orbiting Carbon Observatory-2, which launched on July 2, will soon be providing about 100,000 high-quality measurements each day of carbon dioxide concentrations from around the globe. Atmospheric scientists are excited about that. But to understand the processes that control the amount of the greenhouse gas in the atmosphere, they need to know more than just where carbon dioxide is now. They need to know where it has been. It takes more than great data to figure that out.

"In a sense, you're trying to go backward in time and space," said David Baker, a scientist at Colorado State University in Fort Collins. "You're reversing the flow of the winds to determine when and where the input of carbon at the Earth's surface had to be to give you the measurements you see now."

Harry Potter used a magical time turner to travel to the past. Atmospheric scientists use a type of computer model called a chemical transport model. It combines the atmospheric processes found in a climate model with additional information on important chemical compounds, including their reactions, their sources on Earth's surface and the processes that remove them from the air, known as sinks.

NASA's Orbiting Carbon Observatory-2 or OCO-2 satellite. Image Credit: NASA

Baker used the example of a forest fire to explain how a chemical transport model works. "Where the fire is, at that point in time, you get a pulse of carbon dioxide in the atmosphere from the burning carbon in wood. The model's winds blow it along, and mixing processes dilute it through the atmosphere. It gradually gets mixed into a wider and wider plume that eventually gets blown around the world."

Some models can be run backward in time -- from a point in the plume back to the fire, in other words -- to search for the sources of airborne carbon dioxide. The reactions and processes that must be modeled are so complex that researchers often cycle their chemical transport models backward and forward through the same time period dozens of times, adjusting the model as each set of results reveals new clues. "You basically start crawling toward a solution," Baker said. "You may not be crawling straight toward the best answer, but you course-correct along the way."


Image above: Scientists will use measurements from the Orbiting Carbon Observatory-2 to track atmospheric carbon dioxide to sources such as these wildfires in Siberia, imaged on May 18 by NASA's Moderate Resolution Imaging Spectrometer. Image Credit: NASA/LANCE/EOSDIS Rapid Response.

Lesley Ott, a climate modeler at NASA's Goddard Space Flight Center, Greenbelt, Maryland, noted that simulating carbon dioxide's atmospheric transport correctly is a prerequisite for improving the way global climate models simulate the carbon cycle and how it will change with our changing climate. "If you get the transport piece right, then you can understand the piece about sources and sinks," she said. "More and better-quality data from OCO-2 are going to create better characterization of global carbon."

Baker noted that the volume of data provided by OCO-2 will improve knowledge of carbon processes on a finer scale than is currently possible. "With all that coverage, we'll be able to resolve what's going on at the regional scale," Baker said, referring to areas the size of Texas or France. "That will help us understand better how the forests and oceans take up carbon. There are various competing processes, and right now we're not sure which ones are most important."

Ott pointed out that improving the way global climate models represent carbon dioxide provides benefits far beyond the scientific research community. "Trying to figure out what national and international responses to climate change should be is really hard," she said. "Politicians need answers quickly. Right now we have to trust a very small number of carbon dioxide observations. We're going to have a lot better coverage because so much more data is coming, and we may be able to see in better detail features of the carbon cycle that were missed before." Taking those OCO-2 data backward in time may be the next step forward on the road to understanding and adapting to climate change.

To learn more about the OCO-2 mission, visit these websites: http://www.nasa.gov/oco2 and http://oco.jpl.nasa.gov

NASA monitors Earth's vital signs from land, air and space with a fleet of satellites and ambitious airborne and ground-based observation campaigns. NASA develops new ways to observe and study Earth's interconnected natural systems with long-term data records and computer analysis tools to better see how our planet is changing. The agency shares this unique knowledge with the global community and works with institutions in the United States and around the world that contribute to understanding and protecting our home planet.

For more information about NASA's Earth science activities in 2014, visit: http://www.nasa.gov/earthrightnow

OCO-2 is managed by NASA's Jet Propulsion Laboratory, Pasadena, California.

Images (mentioned), Text, Credits: NASA / JPL / Alan Buis, Written by Carol Rasmussen.

Greetings, Orbiter.ch

Spacecraft Foton-M 4 successfully launched


ROSCOSMOS logo.

07.19.2014

Soyuz-2.1a launch (Illustration image)

July 19 at 00 hours 50 minutes Moscow time from the launch complex Sq. 31 took the Baikonur Cosmodrome launch vehicle (LV) Soyuz-2.1a with the spacecraft (SC) Foton-M 4.

In accordance with cyclogram flight 00 hours 58 minutes spacecraft Foton-M 4 (RCC production of Progress, Samara) was launched into orbit.

 Launch of Soyuz 2.1a carrying Foton-M4 science sat from Baikonur

Mass of the satellite is 6840 kg, the mass of scientific instruments - up to 850 kg (600 kg lander inside and up to 250 kg - outside). Lifetime in orbit - 60 days. The average height of the orbit Foton-M 4 is 575 km.

 Foton-M spacecraft description

Spacecraft Foton-M 4 is designed for microgravity experiments, providing reception of new knowledge on the physics of weightlessness and the refinement of manufacturing processes of semiconductor materials, biomedical products with improved performance, as well as conducting biological and biotechnological research.

Among them - the joint Russian-German experiments in growing semiconductor crystals under microgravity conditions by setting KBTS 15.

This setting is developed in the Research Institute of launch complexes VPBarmin name, one of the largest of scientific equipment on board a spacecraft Foton-M 4. It is an automatic oven ELECTROVACUUM Polizon-2 with temperature from 400 to 1200 degrees, equipped with a control system, automatic feeding and evacuating one of the 12 capsules with samples.

Foton-M spacecraft

By using the zone melting method and in the directional solidification furnace scientists can investigate the growth of crystal lattices in microgravity obtain highly purified crystals with improved structure, which can be useful for industry, able to investigate the crystallization process under magnetic field and vibration.

Among the 12 capsules have several prepared by scientists from the Institute of Crystallography and Materials Science Center of the University of Freiburg. German researchers intend to carry on board the Foton-M 4 five experiments with semiconductor materials that are essential for modern electronics, in particular gallidom germanium (GeGa), germanium silicide (GeSi), cadmium zinc telluride, (CdZnTe).

In automatic electric-furnace Polizon-2, these samples will melt and form a homogeneous due to weightlessness crystals, devoid of defects. The results obtained will allow scientists to improve the technology in the world.

ROSCOSMOS Press Release: http://www.roscosmos.ru/20780/

Images, Text, Credits: Roscosmos press service / ROSCOSMOS / Translation: Orbiter.ch Aerospace.

Best regards, Orbiter.ch

Versatility extends life of water mission


ESA - SMOS Mission logo.

18 July 2014

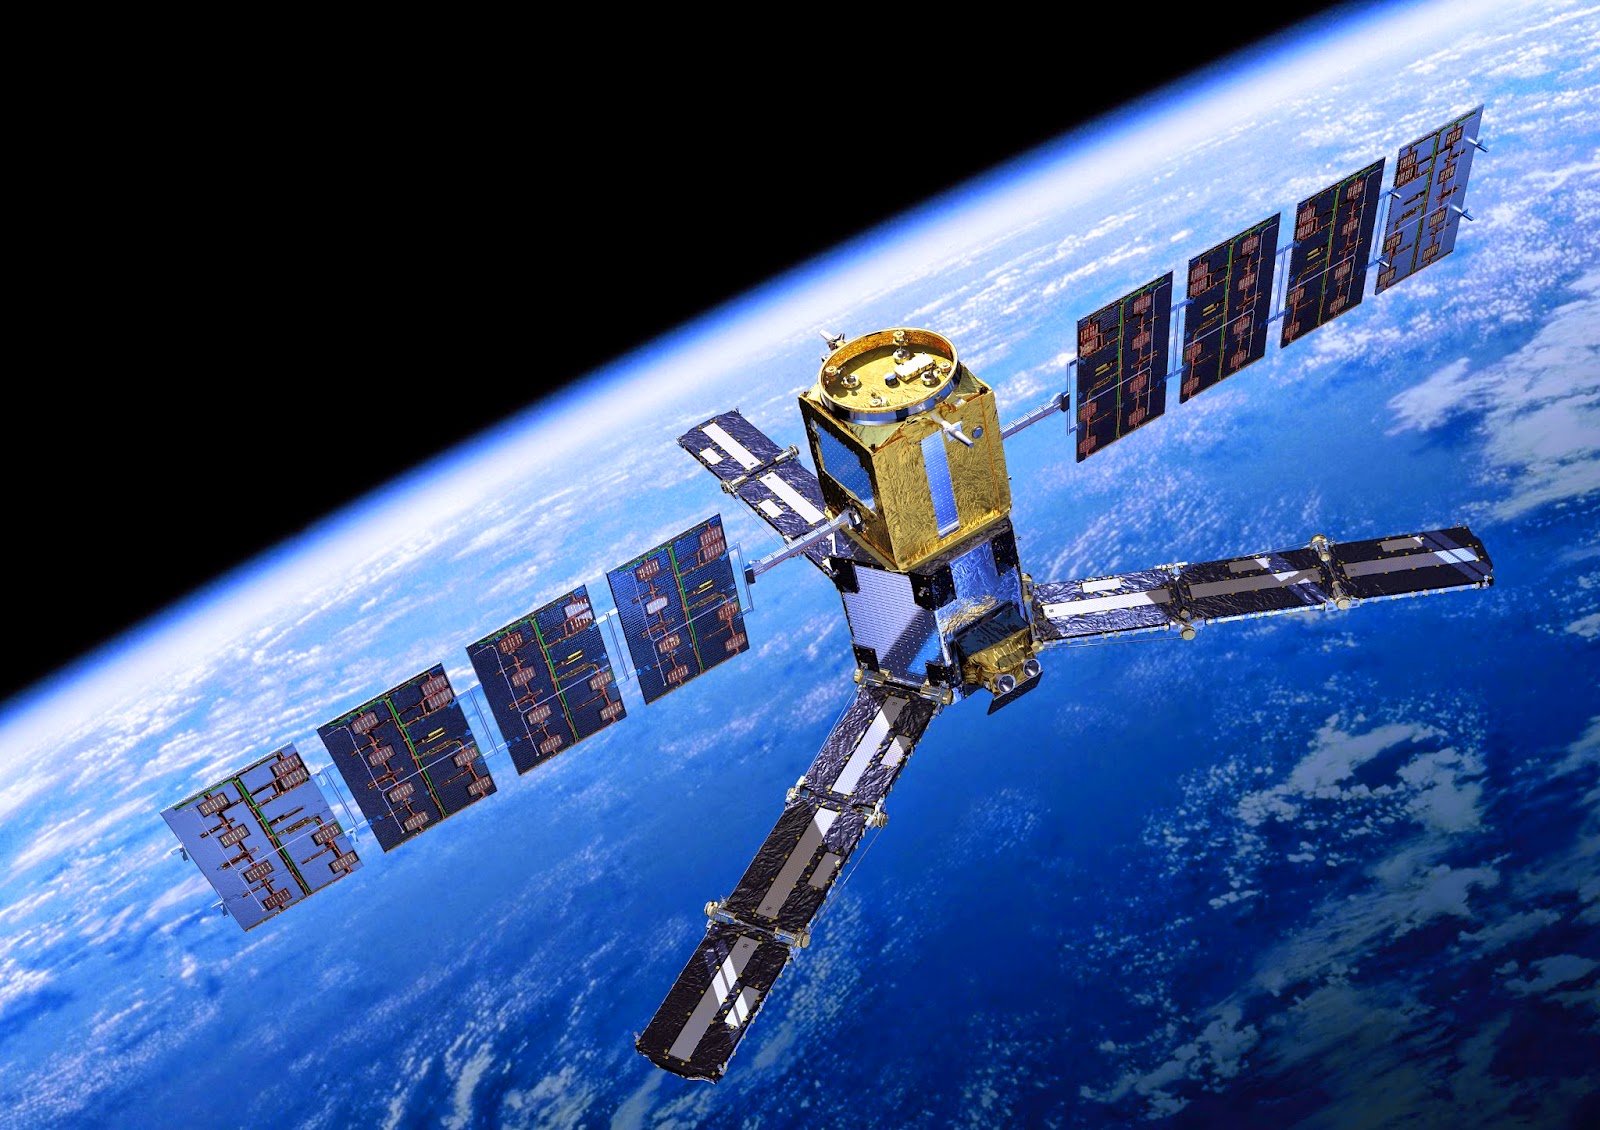
SMOS is not only delivering key information on soil moisture and ocean salinity for science, but its data are also being used for a growing number of practical applications. Reflecting this versatility along with new synergistic opportunities, the mission will now remain operational until at least 2017.

ESA’s Soil Moisture and Ocean Salinity (SMOS) satellite has been in orbit around Earth for almost five years.

Thin sea ice

Going way beyond its original scientific brief of delivering critical information to understand Earth’s water cycle, it continues to demonstrate its suitability for new uses.

The most recent examples from this multi-talented mission include being able to provide information to measure thin ice floating in the polar seas accurately enough for forecasting and ship routing.

Sea ice that is less than 50 cm thick is particularly important for weather and climate as it controls the exchange of heat and water between the ocean and atmosphere.

SMOS in orbit

SMOS uses an innovative technique of capturing images of brightness temperature, which correspond to radiation emitted from Earth’s surface to produce maps of soil moisture and ocean salinity.

While it wasn’t designed to measure ice, radiation emitted by the ice allows SMOS to ‘see’ through the surface, yielding ice-thickness measurements down to 50 cm – mainly the thinner younger ice at the edge of the Arctic Ocean.

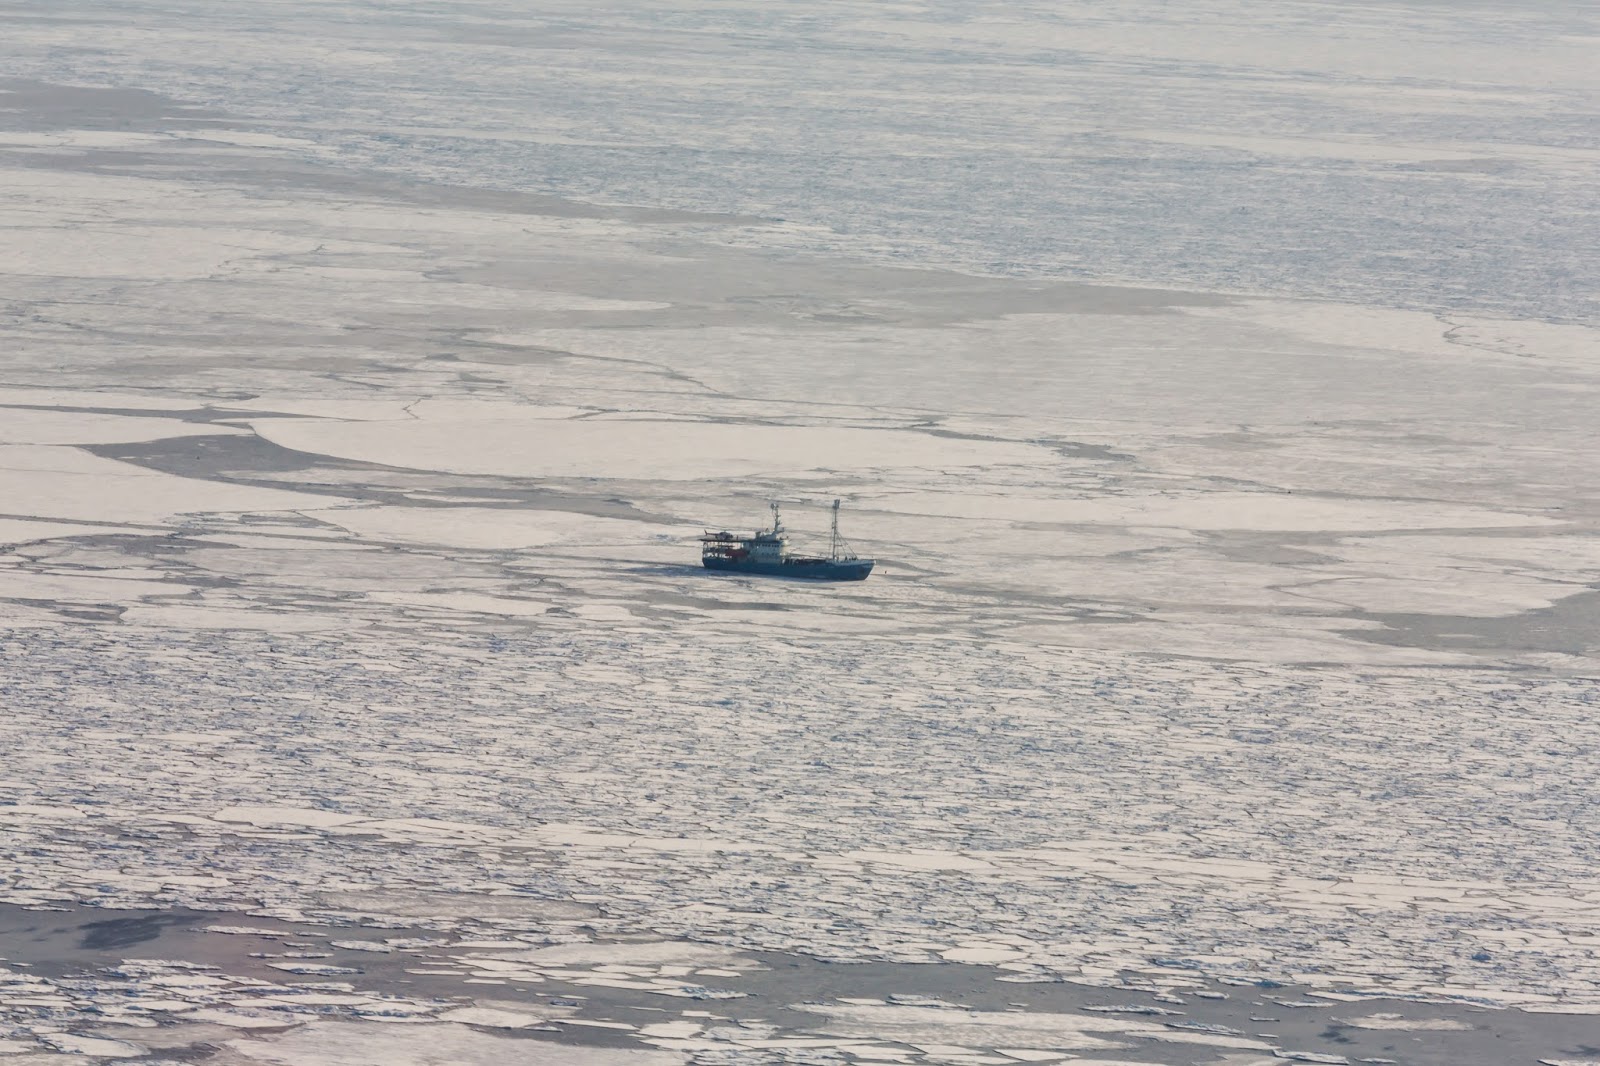
RV Lance in the Barents Sea

In recent years, this information has been much sought after by operational users. Taking data from SMOS, a product has been developed by the University of Hamburg and, with ESA’s help, has now been set up as a service.

Lars Kaleschke from the University of Hamburg’s Center for Earth System Research and Sustainability said, “The provision of our sea-ice thickness data product to operational users on a continuous basis is excellent proof of SMOS’s skill for operational applications.”

By piggybacking on Germany’s IRO-2 project, through which a prototype system for sea-ice forecasting and ship routing is being developed, ESA carried out the SMOS-ice field campaign earlier this year to validate the new data product.

Sea-ice thickness from SMOS

Battling cold and storms, vital ground-truth information was gathered by an electromagnetic sensor suspended from a helicopter. The helicopter and team were carried on the RV Lance, which sailed into the polar sea-ice from Svalbard, Norway.

Matthias Drusch, ESA’s Mission Scientist for SMOS, took part in this rather special venture and said,  “Conceiving the idea for a new data product and developing it is only part of the task – proof that the concept actually works with real data is very exciting and rewarding.”

SMOS is also being used by the US Department of Agriculture to predict drought and by the European Centre for Medium-Range Weather Forecasts to help improve air temperature and humidity forecasts.

SMOS boosts soil moisture mapping

Based on achievements such as these and the fact that the satellite is still in very good health, ESA’s Member States and the French space agency CNES, which is responsible for operating the satellite platform, have decided to extend the mission’s original planned life of five years.

Susanne Mecklenburg, ESA’s SMOS Mission Manager, said, “Extending operations until 2017 gives us more opportunities to look at new scientific and pre-operational applications which otherwise we wouldn’t have  been able to pursue. Moreover, new synergies will now be possible.

Helicopter on RV Lance

“For example, SMOS data can be combined with those of NASA’s Soil Moisture Active Passive, SMAP, mission that will be launched at beginning of November this year.

“There are also opportunities to combine SMOS with the data from the Copernicus Sentinel missions. For example, the sea-surface salinity data from SMOS could be used in synergy with sea-surface temperature and sea-surface height information from Sentinel-3.”

Related links:

CNES: http://www.cnes.fr/web/CNES-en/7114-home-cnes.php

SMAP: https://smap.jpl.nasa.gov/

Sentinels: http://www.esa.int/Our_Activities/Observing_the_Earth/Copernicus/Overview4

University of Hamburg Center for Earth System Research and Sustainability: http://www.cen.uni-hamburg.de/en.html

IRO-2: http://www.iro-2.de/index.html

Access SMOS data: http://earth.esa.int/SMOS/

Campaigns blog: http://blogs.esa.int/campaignearth/

ESA's SMOS Mission website: http://www.esa.int/Our_Activities/Observing_the_Earth/The_Living_Planet_Programme/Earth_Explorers/SMOS

Images, Animation, Text, Credits: ESA/S. Hendriks/AWI/AOES Medialab/University of Hamburg Institute of Oceanography/USDA FAS/IRO-2 Team.

Greetings, Orbiter.ch

jeudi 17 juillet 2014

Lunar Pits Could Shelter Astronauts, Reveal Details of How 'Man in the Moon' Formed


NASA - Lunar Reconnaissance Orbiter (LRO) patch.

July 17, 2014

While the moon's surface is battered by millions of craters, it also has over 200 holes – steep-walled pits that in some cases might lead to caves that future astronauts could explore and use for shelter, according to new observations from NASA's Lunar Reconnaissance Orbiter (LRO) spacecraft.

Peeking Into Lunar Pits

Video above: This video shows images from NASA's LRO spacecraft of various lunar pits. Image Credit: NASA's Goddard Space Flight Center/D. Gallagher.

The pits range in size from about 5 meters (~5 yards) across to more than 900 meters (~984 yards) in diameter, and three of them were first identified using images from the Japanese Kaguya spacecraft. Hundreds more were found using a new computer algorithm that automatically scanned thousands of high-resolution images of the lunar surface from LRO's Narrow Angle Camera (NAC).


Image above: This is a spectacular high-Sun view of the Mare Tranquillitatis pit crater revealing boulders on an otherwise smooth floor. This image from LRO's NAC is 400 meters (1,312 feet) wide, north is up. Image Credit: NASA/GSFC/Arizona State University.

"Pits would be useful in a support role for human activity on the lunar surface," said Robert Wagner of Arizona State University, Tempe, Arizona. "A habitat placed in a pit -- ideally several dozen meters back under an overhang -- would provide a very safe location for astronauts: no radiation, no micrometeorites, possibly very little dust, and no wild day-night temperature swings." Wagner developed the computer algorithm, and is lead author of a paper on this research now available online in the journal Icarus.

Most pits were found either in large craters with impact melt ponds – areas of lava that formed from the heat of the impact and later solidified, or in the lunar maria – dark areas on the moon that are extensive solidified lava flows hundreds of miles across. In ancient times, the maria were thought to be oceans; "maria" is the Latin word for "seas." Various cultures have interpreted the patterns formed by the maria features in different ways; for example, some saw the face of a man, while others saw a rabbit or a boy carrying a bundle of sticks on his back.

The pits could form when the roof of a void or cave collapses, perhaps from the vibrations generated by a nearby meteorite impact, according to Wagner. However, he noted that from their appearance in the LRO photos alone, there is little evidence to point to any particular cause. The voids could be created when molten rock flowed under the lunar surface; on Earth, lava tubes form when magma flows beneath a solidified crust and later drains away. The same process could happen on the moon, especially in a large impact crater, the interior of which can take hundreds of thousands of years to cool, according to Wagner. After an impact crater forms, the sides slump under lunar gravity, pushing up the crater's floor and perhaps causing magma to flow under the surface, forming voids in places where it drains away.

Exploring impact melt pits would pin down the nature of the voids in which they form. "They are likely due to melt flow within the pond from uplift after the surface has solidified, but before the interior has cooled," said Wagner. "Exploring impact melt pits would help determine the magnitude of this uplift, and the amount of melt flow after the pond is in place."

Exploring the pits could also reveal how oceans of lava formed the lunar maria. "The mare pits in particular would be very useful for understanding how the lunar maria formed. We've taken images from orbit looking at the walls of these pits, which show that they cut through dozens of layers, confirming that the maria formed from lots of thin flows, rather than a few big ones. Ground-level exploration could determine the ages of these layers, and might even find solar wind particles that were trapped in the lunar surface billions of years ago," said Wagner.

To date, the team has found over 200 pits spread across the melt ponds of 29 craters, which are considered geologically young "Copernican" craters at less than a billion years old; eight pits in the lunar maria, three of which were previously known from images from the Japanese Kaguya orbiter; and two pits in highlands terrain.


Image above: These images from NASA's LRO spacecraft show all of the known mare pits and highland pits. Each image is 222 meters (about 728 feet) wide. Image Credit: NASA/GSFC/Arizona State University.

The general age sequence matches well with the pit distributions, according to Wagner. "Impact melt ponds of Copernican craters are some of the younger terrains on the moon, and while the maria are much older at around three billion years old, they are still younger and less battered than the highlands. It's possible that there's a 'sweet spot' age for pits, where enough impacts have occurred to create a lot of pits, but not enough to destroy them," said Wagner.

There are almost certainly more pits out there, given that LRO has only imaged about 40 percent of the moon with appropriate lighting for the automated pit searching program, according to Wagner. He expects there may be at least two to three more mare pits and several dozen to over a hundred more impact melt pits, not including any pits that likely exist in already-imaged areas, but are too small to conclusively identify even with the NAC's resolution.

"We'll continue scanning NAC images for pits as they come down from the spacecraft, but for about 25 percent of the moon's surface area (near the poles) the sun never rises high enough for our algorithm to work," said Wagner. "These areas will require an improved search algorithm, and even that may not work at very high latitudes, where even a human has trouble telling a pit from an impact crater."

The next step would be to tie together more datasets such as composition maps, thermal measurements, gravity measurements, etc., to gain a better understanding of the environments in which these pits form, both at and below the surface, according to Wagner.

"The ideal follow-up, of course, would be to drop probes into one or two of these pits, and get a really good look at what's down there," adds Wagner. "Pits, by their nature, cannot be explored very well from orbit -- the lower walls and any floor-level caves simply cannot be seen from a good angle. Even a few pictures from ground-level would answer a lot of the outstanding questions about the nature of the voids that the pits collapsed into. We're currently in the very early design phases of a mission concept to do exactly this, exploring one of the largest mare pits."

The research was funded by NASA's LRO project. Launched on June 18, 2009, LRO has collected a treasure trove of data with its seven powerful instruments, making an invaluable contribution to our knowledge about the moon. LRO is managed by NASA's Goddard Space Flight Center in Greenbelt, Maryland, for the Science Mission Directorate at NASA Headquarters in Washington.

Related Link:

NASA's LRO website: http://www.nasa.gov/lro

Images (mentioned), Video (mentioned), Text, Credits: NASA's Goddard Space Flight Center / Bill Steigerwald.

Greetings, Orbiter.ch

A Ten-Year Endeavor: NASA’s Aura and Climate Change


NASA - EOS AURA Mission patch.

July 17, 2014

Nitrogen and oxygen comprise nearly 99 percent of Earth’s atmosphere. The remaining one percent is comprised of gases that— although present in small concentrations— can have a big impact on life on Earth. Trace gases called greenhouse gases warm the surface, making it habitable for humans, plants and animals. But these greenhouse gases, as well as clouds and tiny particles called aerosols in the atmosphere, also play vital roles in Earth’s complex climate system.

Celebrating its tenth anniversary this week, NASA’s Aura satellite and its four onboard instruments measure some of the climate agents in the atmosphere including greenhouse gases, clouds and dust particles. These global datasets provide clues that help scientists understand how Earth’s climate has varied and how it will continue to change.

NASA 10 Years of Aura Legacy

Video above: The Aura atmospheric chemistry satellite celebrates its 10th anniversary on July 15, 2014. Since its launch in 2004, Aura has monitored Earth's atmosphere and provided data on the ozone layer, air quality, and greenhouse gases associated with climate change. Image Credit: NASA's Goddard Space Flight Center.

Measuring Greenhouse Gases

When the sun shines on Earth, some of the light reaches and warms the surface. The surface then radiates this heat back outward, and greenhouse gases stop some of the heat from escaping to space, keeping the surface warm. Greenhouse gases are necessary to keep Earth at a habitable temperature, but since the industrial revolution, greenhouse gases have increased substantially, causing an increase in temperature. Aura provides measurements of greenhouses gases such as ozone and water vapor, helping scientists understand the gases that influence climate.

People, plants and animals live in the layer of the atmosphere called the troposphere. In this layer, the temperature decreases with altitude, as mountain climbers experience. The temperature starts to increase again at the tropopause, a surface located about eight miles above the surface at temperate latitudes, which includes, for example, the U.S. and Europe. Closer to the equator, the tropopause is about 11 miles from the surface. In the middle and upper troposphere, ozone acts as a greenhouse gas, trapping heat in Earth’s atmosphere. Tropospheric ozone is one of the most important human-influenced greenhouse gases.

Artist's concept of NASA’s Aura satellite. Image Credit: NASA Goddard Space Flight Center

Aura’s Tropospheric Emission Spectrometer (TES) delivers global maps showing annual averages of the heat absorbed by ozone, in particular in this middle troposphere altitude region. Using these maps and computer models, researchers learned that ozone trapped different amounts of heat in Earth’s atmosphere depending on its geographic location. For instance, ozone appeared to be a more effective greenhouse gas over hotter regions like the tropics or cloud-free regions like the Middle East.

“If you want to understand climate change, you need to monitor the greenhouse gases and how they change over time,” said Bryan Duncan, an atmospheric scientist at NASA's Goddard Space Flight Center in Greenbelt, Maryland. Along with ozone, Aura measures other important greenhouse gases such as methane, carbon dioxide and water vapor.

Improving Climate Models

In addition to greenhouse gases, Aura measures several other constituents relevant to climate— smoke, dust and clouds including the ice particles within the clouds— that are important for testing and improving climate models.

“If you don’t have any data, then you don’t know if the models are right or not.” said Anne Douglass, Aura Project Scientist at Goddard. “The models can only be as good as your knowledge.”

Clouds affect Earth’s climate depending on their altitude and latitude. Two of Aura’s instruments have provided information about tropical clouds. Like greenhouse gases, high, thin clouds in the tropics absorb some of Earth’s outgoing heat and warm the surface. Aura’s High Resolution Dynamics Limb Sounder (HIRDLS) instrument provided global maps showing cirrus clouds in the upper altitudes in the tropics. Researchers have used these data along with data records from previous satellites going back to 1985 to show that the tropical cirrus cloud distribution has been steady, giving scientists information about the interplay between water vapor, ice and the life cycle of these clouds.

Aura’s Microwave Limb Sounder (MLS) instrument made the first global measurements of cloud ice content in the upper troposphere, providing new data input for climate models. MLS showed cloud ice is often present over warm oceans. Along with satellite rainfall data, MLS shows that dirty, polluted clouds rain less than clean clouds. The novel relationships obtained from HIRDLS and MLS connect ocean temperatures with clouds and ice and quantify effects of pollution on tropical rainfall— which are important assessments for climate models.

Aerosols, small particles in the atmosphere, influence climate. However, their influence is challenging to decipher because they play several different roles. Aerosols reflect radiation from the sun back into space; this tends to cool Earth’s surface. Aerosols such as dust and smoke also absorb radiation and heat the atmosphere where they are concentrated. Aura’s Ozone Monitoring Instrument (OMI) is especially good at observing these absorbing aerosols above clouds and bright deserts. Both OMI and TES also provide data on gases, such as sulfur dioxide and ammonia, which are primary ingredients for other types of less absorbing aerosols. Aura data, in conjunction with other satellite data, are helping scientists understand how aerosols interact with incoming sunlight in the Earth’s atmosphere; this in turn helps scientists improve long-term predictions in climate models.

Learning from Long Data Sets

Researchers investigated how natural phenomena such as El Niño affect tropospheric ozone concentrations—a study made possible by Aura’s extensive data set.

El Niño is an irregularly occurring phenomena associated with warm ocean currents near the Pacific coast of South America that changes the pattern of tropical rainfall. Occasional appearance of areas of warmer temperatures in the Pacific Ocean shifts the stormiest area from the west to the east; the region of upward motion— a hallmark of low ozone concentrations over the ocean— moves along with it.

Without a decade-long data record, researchers would not be able to conduct such a study. Using the extensive data set, researchers are able to separate the response of ozone concentrations to the changes in human activity, such as biomass burning, from its response to natural forcing such as El Niño.

“Studies like these that investigate how the composition of the troposphere responds to a natural variation are important for understanding how the Earth system will respond to other forcing, potentially including changes in climate,” said Douglass.  “The Earth system is complex, and Aura’s breadth and the length of the composition data record help us to understand this important part of the system.”

Related links:

Aura mission website: http://aura.gsfc.nasa.gov/

Image (mentioned), Video (mentioned), Text, Credits: NASA’s Goddard Space Flight Center / Kasha Patel.

Cheers, Orbiter.ch

The dual personality of comet 67/C-G


ESA - Rosetta Mission patch.

17 July 2014

This week's images of comet 67P/Churyumov-Gerasimenko reveal an extraordinarily irregular shape. We had hints of that in last week's images and in the unscheduled previews that were seen a few days ago, and in that short time it has become clear that this is no ordinary comet. Like its name, it seems that comet 67P/C-G is in two parts.

What the spacecraft is actually seeing is the pixelated image shown at right, which was taken by Rosetta's OSIRIS narrow angle camera on 14 July from a distance of 12 000 km.

A second image and a movie show the comet after the image has been processed. The technique used, called "sub-sampling by interpolation", only acts to remove the pixelisation and make a smoother image, and it is important to note that the comet's surface features won't be as smooth as the processing implies. The surface texture has yet to be resolved simply because we are still too far away; any apparent brighter or darker regions may turn out to be false interpretations at this early stage.


Image above: Comet 67P/C-G on 14 July 2014. Credits: ESA/Rosetta/MPS for OSIRIS Team MPS/UPD/LAM/IAA/SSO/INTA/UPM/DASP/IDA.

But the movie, which uses a sequence of 36 interpolated images each separated by 20 minutes, certainly provides a truly stunning 360-degree preview of the overall complex shape of the comet. Regardless of surface texture, we can certainly see an irregular shaped world shining through. Indeed, some people have already likened the shape to a duck, with a distinct body and head.

Although less obvious in the 'real' image, the movie of interpolated images supports the presence of two definite components. One segment seems to be rather elongated, while the other appears more bulbous.


Animation above: Rotating view of comet 67P/C-G on 14 July 2014. Credits: ESA/Rosetta/MPS for OSIRIS Team MPS/UPD/LAM/IAA/SSO/INTA/UPM/DASP/IDA.

Dual objects like this – known as 'contact binaries' in comet and asteroid terminology – are not uncommon.

Indeed, comet 8P/Tuttle is thought to be such a contact binary; radio imaging by the ground-based Arecibo telescope in Puerto Rico in 2008 suggested that it comprises two sphere-like objects. Meanwhile, the bone-shaped comet 103P/Hartley 2, imaged during NASA's EPOXI flyby in 2011, revealed a comet with two distinct halves separated by a smooth region. In addition, observations of asteroid 25143 Itokawa by JAXA's Hayabusa mission, combined with ground-based data, suggest an asteroid comprising two sections of highly contrasting densities.

Is Rosetta en-route to rendezvous with a similar breed of comet? The scientific rewards of studying such a comet would be high, as a number of possibilities exist as to how they form.

One popular theory is that such an object could arise when two comets – even two compositionally distinct comets – melded together under a low velocity collision during the Solar System's formation billions of years ago, when small building blocks of rocky and icy debris coalesced to eventually create planets. Perhaps comet 67P/C-G will provide a unique record of the physical processes of accretion.

Or maybe it is the other way around – that is, a single comet could be tugged into a curious shape by the strong gravitational pull of a large object like Jupiter or the Sun; after all, comets are rubble piles with weak internal strength as directly witnessed in the fragmentation of comet Shoemaker-Levy 9 and the subsequent impacts into Jupiter, 20 years ago this week. Perhaps the two parts of comet 67P/C-G will one day separate completely.

On the other hand, perhaps comet 67P/C-G may have once been a much rounder object that became highly asymmetric thanks to ice evaporation. This could have happened when the comet first entered the Solar System from the Kuiper Belt, or on subsequent orbits around the Sun.


Image above: Comet 67P/C-G on 14 July 2014 - processed view. Credits: ESA/Rosetta/MPS for OSIRIS Team MPS/UPD/LAM/IAA/SSO/INTA/UPM/DASP/IDA.

One could also speculate that the striking dichotomy of the comet's morphology is the result of a near catastrophic impact event that ripped out one side of the comet. Similarly, it is not unreasonable to think that a large outburst event may have weakened one side of the comet so much that it simply gave away, crumbling into space.

But, while the interpolated images are certainly brilliant, we need to be closer still to see a better three-dimensional view – not to mention to perform a spectroscopic analysis to determine the comet's composition – in order to draw robust scientific conclusions about this exciting comet.

Rosetta Mission Manager Fred Jansen comments: "We currently see images that suggest a rather complex cometary shape, but there is still a lot that we need to learn before jumping to conclusions. Not only in terms of what this means for comet science in general, but also regarding our planning for science observations, and the operational aspects of the mission such as orbiting and landing.

"We will need to perform detailed analyses and modelling of the shape of the comet to determine how best we can fly around such a uniquely shaped body, taking into account flight control and astrodynamics, the science requirements of the mission, and the landing-related elements like landing site analysis and lander-to-orbiter visibility. But, with fewer than 10 000 km to go before the 6 August rendezvous, our open questions will soon be answered."

For more information about Rosetta Mission, visit: http://www.esa.int/Our_Activities/Space_Science/Rosetta

Images (mentioned), Animation (mentioned), Text, Credit: ESA.

Best regards, Orbiter.ch

Comet Ison's dramatic final hours


ESA - SOHO Mission patch.

17 July 2014

A new analysis of data from the ESA/NASA Solar and Heliospheric Observatory (SOHO) spacecraft has revealed that comet 2012/S1 (ISON) stopped producing dust and gas shortly before it raced past the Sun and disintegrated.

When comet ISON was discovered in the autumn of 2012, astronomers hoped that it would eventually light up the night sky to become a "comet of the century". Orbital analysis showed that the sungrazing intruder from the outer reaches of the Solar System would pass only 1.2 million kilometres above the Sun's visible surface on 28 November 2013.

SOHO/LASCO view of Comet ISON, 27-30 November 2013. Credit: SOHO (ESA & NASA)

Based on its early brightness, the comet promised to be a unique research object and, should it survive its flyby of the Sun, a stunning celestial phenomenon in the weeks preceding Christmas. However, it soon became clear that these hopes and expectations would not be met.

During the final phase of the approach to perihelion (its nearest approach to the Sun), the comet's tail became increasingly faint. It was clear that ISON's activity had ceased or that the nucleus had completely disintegrated.

Hours before ISON reached perihelion, stunning images taken by SOHO's Large Angle and Spectrometric Coronagraph (LASCO) showed the bright, elongated tail of the onrushing comet. Unfortunately, ISON's trajectory took it so close to the Sun - about 1.2 million kilometres above its visible surface - that the final phase of the encounter was obscured by LASCO's occulting disc, which blocks light from the Sun to create an artificial solar eclipse.

Researchers at the Max Planck Institute for Solar System Research (MPS) turned to the Solar Ultraviolet Measurements of Emitted Radiation (SUMER) instrument in order to reconstruct the comet's behaviour during its final hours. The SUMER spectrograph on board SOHO was the only instrument capable of obtaining comet data during the final minutes of its approach to the Sun.

SOHO/SUMER view of Comet ISON, 28 November 2013. Credit: MPS

"The only instrument that could obtain serviceable data at this time was SUMER," says Werner Curdt from the MPS, first author of a paper in the latest issue of the journal Astronomy & Astrophysics. Curdt has been head of the SUMER team since 2002.

"For everyone involved, this was a huge challenge," he adds. "The instrument was designed to investigate plasma flows, temperatures, and density in the Sun's hot outer atmosphere, not to detect a comparatively faint comet."

By operating the instrument in camera mode, the researchers were able to record images of the comet's tail in far ultraviolet light with a wavelength of 121.6 nanometres. This light was emitted from the solar disc and reflected by the dust particles into space.

The SUMER data showed the dust tail between 17:56 and 18:01 (GMT) on 28 November, shortly before closest approach. The images showed a slightly curved, pointed tail with a length of at least 240 000 kilometres. No signs of a particularly bright area were found at the position where the comet's active nucleus was predicted to be.

 To understand what processes generated this tail shape, the researchers compared the images with computer simulations. They calculated what the tail would look like, after making certain assumptions about the size of the dust particles, their speed and the time of their emission.

Spectral information was also obtained by SUMER, starting at 18:02 (GMT). The instrument was repointed every ten minutes to track the comet, but most of these spectra had an extremely low signal, indicating an absence of cometary gas or plasma.

"Our measurements and calculations indicate that ISON ran out of steam before perihelion," says Curdt.

"During our modelling of the event, we were not able to reconstruct anything resembling our images, assuming that ISON was still active during the SUMER observations," says comet researcher and co-author Hermann Böhnhardt from the MPS.

Instead, the MPS model most consistent with the observations indicates that the comet stopped producing dust and gas hours earlier. Whether the nucleus completely disintegrated cannot be settled for certain, according to Böhnhardt. However, several pieces of evidence indicate that this was the case.

The arrow-shaped coma of the comet indicates that there was a short, violent outburst which released a great amount of dust, 8.5 hours before it was due to pass by the Sun. Calculations show that the comet must have emitted around 11 500 tonnes of dust at this time.

"It is most likely that the final break-up of the nucleus triggered this eruption, abruptly releasing gas and dust trapped inside the nucleus," says Werner Curdt. "Within a few hours the dust production stopped completely."

"SOHO has now been sending back a stream of data about our nearest star and thousands of sungrazing comets for more than 18 years," says Bernhard Fleck, ESA's SOHO project scientist.

"Observations such as those made of comet ISON show that the observatory still has an important role to play in improving our understanding of the Sun and its influence on the planets and other objects which orbit around it."
More information

"Scattered Lyman-α radiation of comet 2012/S1 (ISON) observed by SUMER/SOHO", by W. Curdt, H. Boehnhardt, J.-B. Vincent, S. K. Solanki, U. Schühle and L. Teriaca, is published in Astronomy & Astrophysics, Volume 567, L1: http://dx.doi.org/10.1051/0004-6361/201423990

SOHO (SOlar Heliospheric Observatory) is a project of international cooperation between ESA and NASA to study the Sun, from its deep core to the outer corona, and the solar wind.

SOHO monitors the Sun constantly from a privileged point in the Sun-Earth system, the first Lagrangian Point (L1). Located between the two celestial bodies, at a distance of about 1.5 million kilometres from the Earth, SOHO enjoys an uninterrupted view of the Sun – something impossible to achieve from a ground-based observatory due to our planet's rotation.

For more information about SOHO Mission, visit: http://soho.esac.esa.int/ and http://www.nasa.gov/mission_pages/soho/

Image (mentioned), Video (mentioned), Text, Credit: ESA.

Cheers, Orbiter.ch

ATV's fiery break-up to be seen from inside


ESA - ATV-5 Georges Lemaître Mission patch.

17 July 2014

As ESA’s remaining supply ferry to the International Space Station burns up in the atmosphere, its final moments as its hull disintegrates will be recorded from the inside by a unique infrared camera.

An ESA-led team designed and developed the Automated Transfer Vehicle (ATV) Break-Up Camera in just nine months in order to make it on board in time.

Artist’s view of ATV-5 reentry

Working at breakneck pace, the team designed, built and tested both the camera and the Reentry SatCom capsule to work like an aircraft-style ’black box’ to store images, then transmit them to Earth after the vessel’s break-up via an Iridium satellite link. 

ESA’s BUC camera will join Japan’s i-Ball optical camera and NASA’s Re-entry Break-up Recorder to give as full a picture as possible of the conditions inside the vehicle as it breaks up.

“These different instruments will complement each other,” explains Neil Murray, leading the project for ESA.

NASA has flown similar experiments before with its recorder, while JAXA’s i-Ball gathered photos during the reentry of their supply ship in 2012.

For ESA, this is something new, however. The challenge has been to design a capsule to survive the 1500ºC reentry and transmit useful data to the ground no matter its altitude or orientation.

BUC Infrared Camera and SatCom

It also needs to overcome the blackout effect of the blowtorch-like ‘plasma’ of electrically charged gases enveloping reentering objects.

The infrared camera, bolted to an ATV rack, will burn up with the rest of the spacecraft, but imagery of the final 20 seconds will be passed to the Reentry SatCom, a spherical capsule protected by a ceramic heatshield.

“The Reentry SatCom has an antenna, so that once ATV breaks up it begins transmitting the data to any Iridium communication satellites in line of sight,” adds Neil.

ATV cutaway

“The break-up will occur at about 80–70 km altitude, leaving the SatCom falling at 6–7 km/s. The fall will generate high-temperature plasma around it, but signals from its omnidirectional antenna should be able to make it through any gap in the plasma to the rear.

“Additionally, signalling will continue after the atmospheric drag has decelerated the SatCom to levels where a plasma is no longer formed – somewhere below 40 km – at a point where Iridium satellites should become visible to it regardless.”

HTV break-up

The latest and last of ESA’s five automated space freighters, Georges Lemaître is being prepared for launch by Ariane 5 from Europe’s Spaceport in French Guiana.

Once in orbit, the ferry will dock to the Station to deliver more than six tonnes of propellant, supplies and experiments to the orbital outpost.

Then, after some six months as part of the Station, it will deliberately reenter over a remote part of the Pacific Ocean to burn up harmlessly.

ATV-4

All previous four ATVs have met the same fiery end, but there is heightened interest in the destructive reentry process this time because it is the final vehicle.

The results will be used to confirm the computer models used to predict the break-up of reentering satellites. As one such craft, the Space Station will eventually be required to come down so there is interest in understanding the process.

ATV-4 burn-up

“The data should also hold broader value,” says Neil. “The project is proceeding under our ‘Design for Demise’ effort to design space hardware in such a way that it is less likely to survive reentry and potentially endanger the public.

“Design for Demise in turn is part of the Agency’s Clean Space initiative, seeking to render the space industry more environmentally friendly in space as well as on Earth.”

Loading ATV-5 cargo

Construction of the camera system and capsule was undertaken for ESA by RUAG in Switzerland, with its thermal protection system contributed by the DLR German Aerospace Center, Switzerland’s ETH Zurich producing its software, Switzerland’s Viasat designing the antenna and electronics, and Denmark’s GomSpace delivering the batteries.

Related links:

ATV 5 Georges Lemaître: http://www.esa.int/Our_Activities/Human_Spaceflight/ATV

For the latest on ATV-5 click here: http://blogs.esa.int/atv/

About Propulsion and Aerothermodynamics: http://www.esa.int/Our_Activities/Space_Engineering/esaTQM/1079452419720_mechanical_0.html

Clean Space: http://www.esa.int/Our_Activities/Technology/Clean_Space

NASA Re-entry Break-up Recorder: http://www.nasa.gov/mission_pages/station/research/news/rebr.html

JAXA i-Ball images of HTV break-up: http://www.spacesafetymagazine.com/reentry-images-show-htv-breakup/

RUAG Space Switzerland: http://www.ruag.com/space/RUAG_Space_Switzerland

DLR: http://www.dlr.de/dlr;internal&action=_setlanguage.action?LANGUAGE=en

ETH Zurich: http://www.ethz.ch/index_EN

ViaSat Antenna Systems: https://www.viasat.com/company/locations/switzerland

GomSpace: http://gomspace.com/index.php?p=home

Images, Text, Credits: ESA/D. Ducros/NASA/CNES/ARIANESPACE–Optique Video du CSG, P. Baudon.

Greetings, Orbiter.ch

mercredi 16 juillet 2014

Looking Back at the Jupiter Crash 20 Years Later


NASA logo.

July 15, 2014


Image above: NASA’s Galileo spacecraft captured these four views of Jupiter as the last of comet Shoemaker-Levy 9’s large fragments struck the planet. Image Credit: NASA/JPL-Caltech.

Twenty years ago, human and robotic eyes observed the first recorded impact between cosmic bodies in the solar system, as fragments of comet Shoemaker-Levy 9 slammed into the atmosphere of Jupiter. Between July 16 and July 22, 1994, space- and Earth-based assets managed by NASA’s Jet Propulsion Laboratory in Pasadena, California, joined an armada of other NASA and international telescopes, straining to get a glimpse of the historic event:


- NASA’s Galileo spacecraft, still a year-and-a-half out from its arrival at Jupiter, had a unique view of fireballs that erupted from Jupiter’s southern hemisphere as the comet fragments struck.

- NASA's Hubble Space Telescope, using the JPL-developed and -built Wide Field and Planetary Camera 2, observed the comet and the impact scars it left on Jupiter.

- The giant radio telescopes of NASA’s Deep Space Network -- which perform radio and radar astronomy research in addition to their communications functions -- were tasked with observing radio emissions from Jupiter's radiation belt, looking for disturbances caused by comet dust.

- NASA’s Voyager 2 spacecraft, then about 3.7 billion miles (6 billion kilometers) from Jupiter, observed the impacts with its ultraviolet spectrometer and a planetary radio astronomy instrument.

- The Ulysses spacecraft also made observations during the comet impact from about 500 million miles (800 million kilometers) away. Ulysses observed radio transmissions from Jupiter with its combined radio wave and plasma wave instrument.

The work of scientists in studying the Shoemaker-Levy 9 impact raised awareness about the potential for asteroid impacts on Earth and the need for predicting them ahead of time, important factors in the formation of NASA's Near-Earth Object Program Office. The NEO Program Office coordinates NASA-sponsored efforts to detect, track and characterize potentially hazardous asteroids and comets that could approach Earth.

The Galileo mission was managed by NASA's Jet Propulsion Laboratory in Pasadena, California, for the agency's Science Mission Directorate. JPL also manages the Voyager mission and the Deep Space Network for NASA. NASA's Near-Earth Object Program at NASA Headquarters, Washington, manages and funds the search, study and monitoring of asteroids and comets whose orbits periodically bring them close to Earth. JPL manages the Near-Earth Object Program Office for NASA's Science Mission Directorate in Washington. JPL is a division of the California Institute of Technology, Pasadena.

For more information about the Shoemaker-Levy 9 impact, visit:
http://solarsystem.nasa.gov/planets/profile.cfm?Object=Com_PShoemakerLevy9

Image (mentioned), Text, Credits: NASA / JPL / Preston Dyches.

Best regards, Orbiter.ch

NASA Rover's Images Show Laser Flash on Martian Rock


NASA - Mars Science Laboratory (MSL) patch.

July 16, 2014

Flash from Curiosity Rover's Laser Hitting a Martian Rock

Video above: The sparks that appear on the baseball-sized rock result from the laser of the ChemCam instrument on NASA's Curiosity Mars rover hitting the rock.

Flashes appear on a baseball-size Martian rock in a series of images taken Saturday, July 12 by the Mars Hand Lens Imager (MAHLI) camera on the arm of NASA's Curiosity Mars Rover. The flashes occurred while the rover's Chemistry and Camera (ChemCam) instrument fired multiple laser shots to investigate the rock's composition.

ChemCam's laser has zapped more than 600 rock and soil targets on Mars since Curiosity landed in the planet's Gale Crater in August 2012.

"This is so exciting! The ChemCam laser has fired more than 150,000 times on Mars, but this is the first time we see the plasma plume that is created," said ChemCam Deputy Principal Investigator Sylvestre Maurice, at the Research Institute in Astrophysics and Planetology, of France's National Center for Scientific Research and the University of Toulouse, France. "Each time the laser hits a target, the plasma light is caught and analyzed by ChemCam's spectrometers. What the new images add is confirmation that the size and shape of the spark are what we anticipated under Martian conditions."


Image above: NASA's Curiosity Mars rover used the camera on its arm on July 12, 2014, to catch the first images of sparks produced by the rover's laser being shot at a rock on Mars. The left image is from before the laser zapped this rock, called "Nova." The spark is at the center of the right image. Image Credit: NASA/JPL-Caltech/MSSS.

Preliminary analysis of the ChemCam spectra from this target rock, appropriately named "Nova," indicates a composition rich in silicon, aluminum and sodium, beneath a dust layer poor in those elements. This is typical of rocks that Curiosity is encountering on its way toward Mount Sharp.

MAHLI Deputy Principal Investigator Aileen Yingst of the Planetary Science Institute, Tucson, Arizona, said, "One of the reasons we took these images is that they allow the ChemCam folks to compare the plume to those they imaged on Earth. Also, MAHLI has captured images of other activities of Curiosity, for documentation purposes, and this was an opportunity to document the laser in action."


Image above: A Martian target rock called "Nova," shown here, displayed an increasing concentration of aluminum as a series of laser shots from NASA's Curiosity Mars rover penetrated through dust on the rock's surface. This pattern is typical of many rocks examined with the rover's laser-firing ChemCam. Image Credit: NASA/JPL-Caltech/LANL/CNES/IRAP/LPGNantes/CNRS/IAS.

Malin Space Science Systems, San Diego, developed, built and operates MAHLI. The U.S. Department of Energy's Los Alamos National Laboratory, in Los Alamos, New Mexico, developed ChemCam in partnership with scientists and engineers funded by the French national space agency (CNES), the University of Toulouse and France's National Center for Scientific Research.

NASA's Mars Science Laboratory Project is using Curiosity to assess ancient habitable environments and major changes in Martian environmental conditions. NASA's Jet Propulsion Laboratory, a division of the California Institute of Technology, Pasadena, built the rover and manages the project for NASA's Science Mission Directorate in Washington.

For more information about Curiosity, visit these sites: http://www.nasa.gov/msl and http://mars.jpl.nasa.gov/msl/

You can follow the mission on Facebook at: http://www.facebook.com/marscuriosity and on Twitter at: http://www.twitter.com/marscuriosity

Images (mentioned), Video, Text, Credits: NASA / JPL / Guy Webster.

Cheers, Orbiter.ch

Cygnus Delivers Science, Station Supplies


NASA / Orbital - Orb-2 Mission patch.

July 16, 2014

The Expedition 40 crew welcomed more than a ton and a half of science, supplies and spacewalking equipment to the International Space Station Wednesday with the arrival of Orbital Sciences’ Cygnus cargo spacecraft.


U.S. Cargo Ship Arrives And Grapples With The International Space Station

With Cygnus securely in the grasp of the Canadarm2 robotic arm, the robotics officer at Mission Control in Houston remotely operated the arm to guide the cargo craft to its berthing port on the Earth-facing side of the Harmony module. Once Cygnus was in position, Flight Engineer Reid Wiseman monitored the Common Berthing Mechanism operations for first and second stage capture of the cargo ship, assuring that the vehicle was securely attached to the station with a hard mate. Second stage capture was completed at 8:53 a.m. EDT.


Image above: Intersecting the thin line of Earth’s atmosphere, the Orbital Sciences’ Cygnus cargo craft attached to the end of the Canadarm2 robotic arm of the International Space Station is photographed by an Expedition 40 crew member after the two spacecraft converged at 6:36 a.m. EDT Wednesday. Image Credit: NASA.

Cygnus was grappled at 6:36 a.m. as it flew within about 32 feet of the complex by Commander Steve Swanson -- with assistance from Flight Engineer Alexander Gerst – as he controlled the 57-foot Canadarm2 from a robotics workstation inside the station’s cupola. Wiseman joined his crewmates in the seven-windowed cupola to assist with the capture and help coordinate the activities. At the time of capture, the orbital laboratory was flying around 260 statute miles over northern Libya.

Orbital Sciences named this newest Cygnus vehicle the SS Janice Voss in honor of the NASA astronaut and Orbital employee who died in February 2012. Swanson paid tribute to his former colleague after the successful grapple as he remarked, "We now have a seventh crew member. Janice Voss is now part of Expedition 40. Janice devoted her life to space and accomplished many wonderful things at NASA and Orbital Sciences, including five shuttle missions. And today, Janice’s legacy in space continues. Welcome aboard the ISS, Janice."


Image above: Canadarm2 berths Orbital Sciences' Cygnus cargo vehicle to the Earth-facing port of the International Space Station's Harmony node. Image Credit: NASA TV.

After Wiseman removed the Centerline Berthing Camera System that provided the teams with a view of berthing operations through the hatch window, he pressurized the vestibule between Harmony and the newly arrived cargo craft and conducted a leak check. Once that was complete, Swanson and Gerst opened the hatch to the vestibule and outfitted the area for the opening of Cygnus’ hatch around 6 a.m. Thursday.

This is Orbital’s second cargo delivery flight to the station through a $1.9 billion NASA Commercial Resupply Services contract. Orbital will fly at least eight cargo missions to the space station through 2016.

The Orbital-2 mission delivered almost 3,300 pounds of supplies to the station to expand the research capability of the Expedition 40 crew. Among the research investigations aboard Cygnus are a flock of Earth-imaging nanosatellites, hardware to enable a trio of free-flying robots to perform 3-D mapping inside the station and a host of student experiments.

Read more about the science aboard Cygnus: http://www.nasa.gov/mission_pages/station/research/news/girl_scouts_orbital_2

Orbital's Cygnus was launched on the company's Antares rocket at 12:52 p.m. Sunday from the Mid-Atlantic Regional Spaceport Pad 0A at NASA’s Wallops Flight Facility in Virginia. Cygnus will remain attached to Harmony until a planned unberthing August 15. After it departs the orbital laboratory, carrying about 3,000 pounds of trash with it, the spacecraft will conduct additional tests for future missions to the space station before a destructive re-entry in Earth's atmosphere.

For Swanson, it was a robotics-intensive day.  After spending his morning at the controls of the robotics workstation for the Cygnus capture, Swanson spent the afternoon beginning the installation of some upgrades for Robonaut 2, the humanoid robot aboard the station. Robonaut, which was delivered to the station in May 2011 during the STS-134 shuttle mission, was designed to test out the capability of a robot to perform tasks deemed too dangerous or mundane for astronauts. Mobility upgrades, including a pair of legs for Robonaut, were delivered to the station during the SpaceX-3 cargo mission in April, Starting with Wednesday’s work to install new helmet pieces and replace Robonaut’s shoulder and elbow covers, Swanson will spend four days upgrading the robot’s torso. Two additional workdays at a later date will see the installation of Robonaut’s legs.


Image above: In this photo posted to Twitter by Flight Engineer Reid Wiseman, Commander Steve Swanson gets set to install some upgrades for Robonaut 2.

On the Russian side of the complex, Flight Engineer Oleg Artemyev downloaded micro-accelerometer data from the Identification experiment, which measures dynamic loads on the station during events such as Wednesday’s grapple and berthing of Cygnus.

Artemyev also performed the VIRU experiment, which seeks to increase the efficiency of training and experiment operations through the use of 3D virtual manuals.

Meanwhile, Flight Engineer Max Suraev performed an inspection of the Zarya module. Also known as the Functional Cargo Block, Zarya was the first component of the space station and was launched on a Russian Proton rocket in November 1998.

Flight Engineer Alexander Skvortsov continued packing the Progress 55 cargo craft with trash and unneeded items for disposal. Progress 55 arrived at the orbiting laboratory in April and will undock from the space station's Pirs docking compartment on Monday at 5:41 p.m. The cargo ship will undergo several days of engineering tests in orbit before being commanded to re-enter Earth's atmosphere for a fiery demise over the Pacific Ocean.

The departure of Progress 55 will clear Pirs for the next Russian space freighter. On July 23, the Progress 56 resupply ship will launch at 5:44 p.m. from the Baikonur Cosmodrome in Kazakhstan (3:44 a.m. local time on July 24), with about 5,700 pounds of food, fuel and supplies for the station's Expedition 40 crew. Progress 56 will make a four-orbit, six-hour trip to the space station and dock at 11:28 p.m.

Related link:

Robonaut 2: http://www.nasa.gov/robonaut

For more information about the International Space Station (ISS), visit: http://www.nasa.gov/mission_pages/station/main/index.html

Images (mentioned), Video, Text, Credit: NASA / NASA TV.

Greetings, Orbiter.ch