vendredi 28 août 2015

NASA’s New Horizons Team Selects Potential Kuiper Belt Flyby Target


NASA - New Horizons Mission logo.

Aug. 28, 2015

NASA has selected the potential next destination for the New Horizons mission to visit after its historic July 14 flyby of the Pluto system. The destination is a small Kuiper Belt object (KBO) known as 2014 MU69 that orbits nearly a billion miles beyond Pluto.


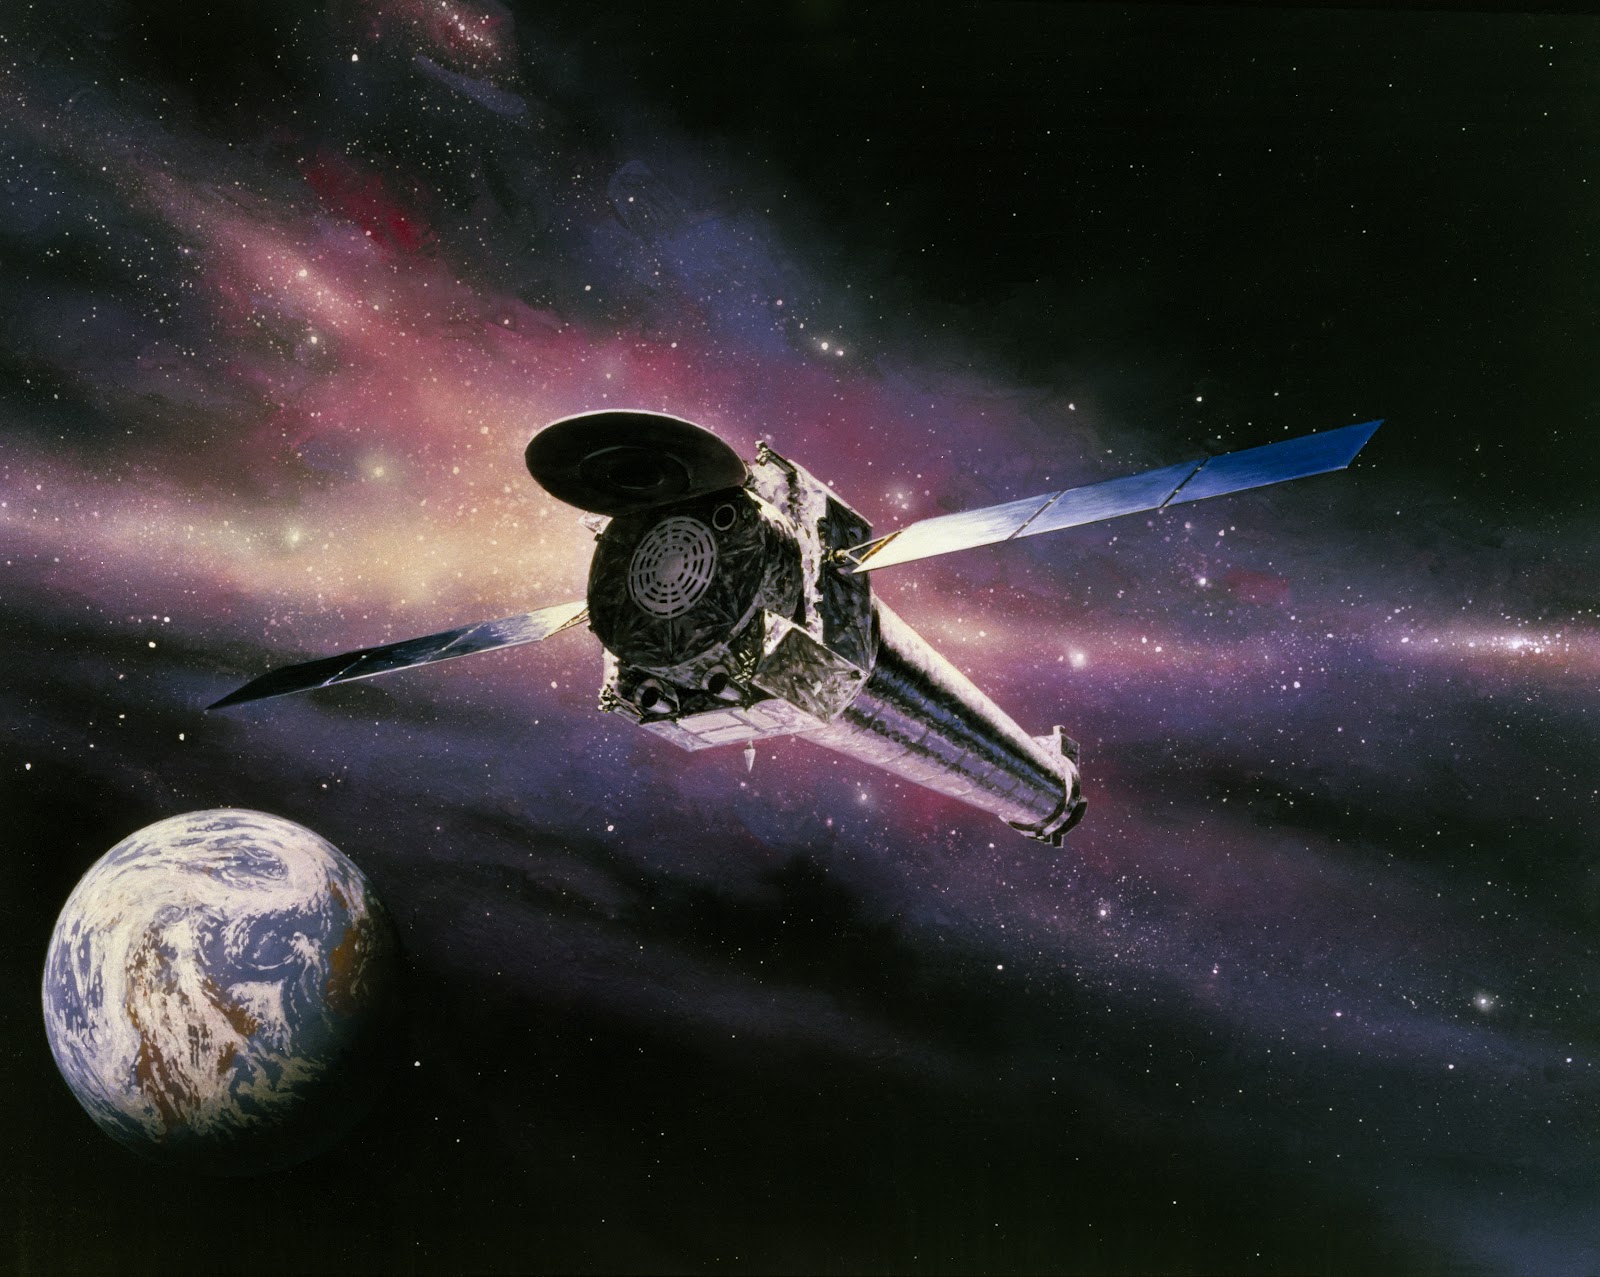
Image above: Artist's impression of NASA's New Horizons spacecraft encountering a Pluto-like object in the distant Kuiper Belt. Image Credits: NASA/JHUAPL/SwRI/Alex Parker.

This remote KBO was one of two identified as potential destinations and the one recommended to NASA by the New Horizons team.  Although NASA has selected 2014 MU69 as the target, as part of its normal review process the agency will conduct a detailed assessment before officially approving the mission extension to conduct additional science.

“Even as the New Horizon’s spacecraft speeds away from Pluto out into the Kuiper Belt, and the data from the exciting encounter with this new world is being streamed back to Earth, we are looking outward to the next destination for this intrepid explorer,” said John Grunsfeld, astronaut and chief of the NASA Science Mission Directorate at the agency headquarters in Washington. “While discussions whether to approve this extended mission will take place in the larger context of the planetary science portfolio, we expect it to be much less expensive than the prime mission while still providing new and exciting science.”

Like all NASA missions that have finished their main objective but seek to do more exploration, the New Horizons team must write a proposal to the agency to fund a KBO mission. That proposal – due in 2016 – will be evaluated by an independent team of experts before NASA can decide about the go-ahead.

Early target selection was important; the team needs to direct New Horizons toward the object this year in order to perform any extended mission with healthy fuel margins. New Horizons will perform a series of four maneuvers in late October and early November to set its course toward 2014 MU69 – nicknamed “PT1” (for “Potential Target 1”) – which it expects to reach on January 1, 2019. Any delays from those dates would cost precious fuel and add mission risk.

“2014 MU69 is a great choice because it is just the kind of ancient KBO, formed where it orbits now, that the Decadal Survey desired us to fly by,” said New Horizons Principal Investigator Alan Stern, of the Southwest Research Institute (SwRI) in Boulder, Colorado. “Moreover, this KBO costs less fuel to reach [than other candidate targets], leaving more fuel for the flyby, for ancillary science, and greater fuel reserves to protect against the unforeseen.”

New Horizons was originally designed to fly beyond the Pluto system and explore additional Kuiper Belt objects. The spacecraft carries extra hydrazine fuel for a KBO flyby; its communications system is designed to work from far beyond Pluto; its power system is designed to operate for many more years; and its scientific instruments were designed to operate in light levels much lower than it will experience during the 2014 MU69 flyby.”

The 2003 National Academy of Sciences’ Planetary Decadal Survey (“New Frontiers in the Solar System”) strongly recommended that the first mission to the Kuiper Belt include flybys of Pluto and small KBOs, in order to sample the diversity of objects in that previously unexplored region of the solar system. The identification of PT1, which is in a completely different class of KBO than Pluto, potentially allows New Horizons to satisfy those goals.

But finding a suitable KBO flyby target was no easy task. Starting a search in 2011 using some of the largest ground-based telescopes on Earth, the New Horizons team found several dozen KBOs, but none were reachable within the fuel supply available aboard the spacecraft.

The powerful Hubble Space Telescope came to the rescue in summer 2014, discovering five objects, since narrowed to two, within New Horizons’ flight path. Scientists estimate that PT1 is just under 30 miles (about 45 kilometers) across; that’s more than 10 times larger and 1,000 times more massive than typical comets, like the one the Rosetta mission is now orbiting, but only about 0.5 to 1 percent of the size (and about 1/10,000th the mass) of Pluto. As such, PT1 is thought to be like the building blocks of Kuiper Belt planets such as Pluto.


Image above: Path of NASA's New Horizons spacecraft toward its next potential target, the Kuiper Belt object 2014 MU69, nicknamed "PT1" (for "Potential Target 1") by the New Horizons team. NASA must approve any New Horizons extended mission to explore a KBO. Image Credits: NASA/JHUAPL/SwRI/Alex Parker.

Unlike asteroids, KBOs have been heated only slightly by the Sun, and are thought to represent a well preserved, deep-freeze sample of what the outer solar system was like following its birth 4.6 billion years ago.

“There’s so much that we can learn from close-up spacecraft observations that we’ll never learn from Earth, as the Pluto flyby demonstrated so spectacularly,” said New Horizons science team member John Spencer, also of SwRI. “The detailed images and other data that New Horizons could obtain from a KBO flyby will revolutionize our understanding of the Kuiper Belt and KBOs.”

The New Horizons spacecraft – currently 3 billion miles [4.9 billion kilometers] from Earth – is just starting to transmit the bulk of the images and other data, stored on its digital recorders, from its historic July encounter with the Pluto system. The spacecraft is healthy and operating normally.

New Horizons is part of NASA’s New Frontiers Program, managed by the agency’s Marshall Space Flight Center in Huntsville, Ala. The Johns Hopkins University Applied Physics Laboratory in Laurel, Md., designed, built, and operates the New Horizons spacecraft and manages the mission for NASA’s Science Mission Directorate. SwRI leads the science mission, payload operations, and encounter science planning.

Related links:

New Horizons: http://www.nasa.gov/mission_pages/newhorizons/main/index.html

Kuiper Belt: http://www.nasa.gov/subject/3151/kuiper-belt

Solar System: http://www.nasa.gov/topics/solarsystem/index.html

Images (mentioned), Text, Credits: NASA/Tricia Talbert.

Greetings, Orbiter.ch

Proton-M with satellite INMARSAT-5F3 was successfully launched


ILS - INMARSAT-5F3 Mission poster.


08/28/2015


Image above: Proton-M with satellite INMARSAT-5F3 was successfully launched from the Baikonur Cosmodrome. Image Credit: ILS/ROSCOSMOS.

International Launch Services (ILS) is returning the Proton M rocket to flight with the launch of the Inmarsat-5 F-3 communications satellite – part of the Inmarsat Global Xpress (GX) system – on a multi-hour flight to its transfer orbit. Launch from the Baikonur Cosmodrome in Kazakhstan took place on schedule at 11:44 GMT.

Launch of a Russian Proton rocket carrying Inmarsat-5-F3

After the regular separation from the third stage of the launch vehicle orbital unit as part of the upper stage Briz-M and the spacecraft Inmarsat-5F3 continues autonomous flight.


Image above: Proton-M with satellite INMARSAT-5F3 in flight, successfully launched from the Baikonur Cosmodrome. Image Credit: ILS/ROSCOSMOS.

Further injection into the target orbit is carried out "razgonnikom" Breeze-M scheme RB trip with five inclusions sustainer engine. The total duration of excretion from the start of the launcher before separation of the spacecraft will be 15 hours and 31 minutes, the separation of spacecraft Inmarsat-5F3 is scheduled for 6:15 Moscow time on 29 August 2015.

Inmarsat-5 F-3 communications satellite. Image Credit: Boeing

Proton and the upper stage Breeze-M are designed and produced by FSUE "Khrunichev. Khrunichev." Upgraded Proton-M, equipped with the upper stage Breeze-M, capable of delivering at geosynchronous transfer orbit a payload of more than 6 tonnes.

The Proton booster launching the Inmarsat-5 F-3 satellite is 4.1 m (13.5 ft) in diameter along its second and third stages, with a first stage diameter of 7.4 m (24.3 ft). The overall height of the three stages of the Proton booster is 42.3 m (138.8 ft).

ROSCOSMOS Press Release: http://www.federalspace.ru/21682/

International Launch Service (ILS) Inmarsat-5 F-3 Mission Control: http://www.ilslaunch.com/mission-control/mission-inmarsat-5-f3

Images (mentioned), Video, Text, Credits: Press Service of the Russian Federal Space Agency/ILS/ROSCOSMOS/Orbiter.ch Aerospace.

Best regards, Orbiter.ch

jeudi 27 août 2015

NASA & JAXA GPM Satellite Analyzes Tropical Storm Erika's Rainfall


NASA / JAXA - Global Precipitation Measurement (GPM) logo.

Aug. 27, 2015

Erika (Atlantic Ocean)

Global Precipitation Measurement (GPM) satellite. Image Credits: NASA/JAXA

The Global Precipitation Measurement or GPM core satellite has provided meteorologists with a look at the towering thunderstorms and heavy rainfall occurring in Tropical Storm Erika as it moves through the Caribbean Sea.

On August 27, 2015, there were many warnings and watches in effect as Tropical Storm Erika continued to rain on Leeward Islands. A Tropical Storm Warning was in effect for Anguilla, Saba and St. Eustatius, St. Maarten, St. Martin, St. Barthelemy, Montserrat, Antigua and Barbuda, St. Kitts and Nevis, Puerto Rico, Vieques, Culebra, U.S. Virgin Islands, British Virgin Islands. A Tropical Storm Watch was in effect for Guadeloupe, the northern coast of the Dominican Republic from Cabo Engano to the border of Haiti, the southeastern Bahamas and the Turks and Caicos Islands.

NASA's GPM Satellite Analyzes Tropical Storm Erika's Rainfall

Video above: GPM showed thunderstorm cloud tops reaching to just over 14 km (8.6 miles) high and PM showed rainfall of up to 52.8 mm (2.0 inches) per hour. The GPM data was overlaid on infrared data from the GOES-East satellite. Video Credits: NASA/JAXA/SSAI, Hal Pierce.

Tropical Storm Erika, the fifth named storm of the season, entered the northeast Caribbean early on the morning of August 27 as it passed through the Leeward Islands between Guadeloupe and Antigua. Fortunately, there were no reports of damage thanks in part to the effects of inhibiting wind shear, which kept the storm from strengthening.

Erika originated as a wave of low pressure that was first detected on Friday, August 21 midway between the West Coast of Africa and the Cape Verde Islands. The wave then tracked westward across the tropical mid Atlantic where it eventually intensified enough to become a tropical storm, Tropical Storm Erika, about three days later on the evening of August 24 (local time, EDT).

At this point, Erika was located about 955 miles due east of the Leeward Islands.  However, despite being over warm water, Erika struggled to intensify as it approached the Leeward Islands over the next few days thanks to an upper-level tough of low pressure near Hispaniola in the north central Caribbean, which created westerly wind shear that disrupted the storm's circulation.

Two instruments aboard GPM captured an image of Erika at 17:26 UTC (1:26 p.m. EDT) on August 26 as the storm was nearing the Leeward Islands. Rain rates derived from the GPM Microwave Imager or GMI captured rain rates in outer area and the Dual-frequency Precipitation Radar or DPR instrument captured rain rates in the inner area. GPM showed rainfall of up to 52.8 mm (2.0 inches) per hour.

The images revealed that the low-level center of circulation was displaced well to the northwest of the storm's rain field, which contains areas of embedded convection (thunderstorms) necessary strengthen and maintain the storm.  However, for the storm to intensify, those areas of convection need to be located close to the storm's core, which is not the case here due to the effects of wind shear.  At about the time of this image, the National Hurricane Center reported that Erika's maximum sustained winds were near 45 mph, making it a weak tropical storm, and that Erika was experiencing moderate northwesterly wind shear as it moved westward near 17 mph.

At NASA's Goddard Space Flight Center in Greenbelt, Maryland, the DPR data was used to create a 3-D rendering of Erika. That 3-D image showed thunderstorm cloud tops reaching to just over 14 km (8.6 miles).

At 11 a.m. EDT (1500 UTC), the center of Tropical Storm Erika was located near latitude 16.4 North, longitude 63.3 West.  Erika is moving toward the west near 16 mph (26 kph).

Satellite Movie Shows Tropical Storm Erika Approaching Puerto Rico

Video above: This animation of images captured August 25 to 27 from NOAA's GOES-West satellite shows Tropical Storm Erika approaching the Leeward Islands and Puerto Rico. TRT: 00:36. Video Credits: NASA/NOAA GOES Project.

The National Hurricane Center (NHC) expects a turn toward the west-northwest later on August 27, and this general motion should continue for the next 48 hours.  On the forecast track, the center of Erika will move near the Virgin Islands later today, move near or north of Puerto Rico tonight, and pass north of the north coast of the Dominican Republic on Friday.

Maximum sustained winds are near 50 mph (85 kph), and NHC expects little change in strength over the next two days. The estimated minimum central pressure is 1006 millibars.

For updates on the forecast and track, and local effects, visit the NHC web page: http://www.nhc.noaa.gov.

GPM is a joint mission between NASA and the Japanese space agency JAXA.

For more onformation about Global Precipitation Measurement (GPM) satellite mission, visit: http://www.nasa.gov/mission_pages/GPM/main/index.html and http://www.eorc.jaxa.jp/GPM/index_e.htm

Image (mentioned), Videos (mentioned), Text, Credits: SSAI/NASA's Goddard Space Flight Center/Steve Lang.

Greetings, Orbiter.ch

Hubble Finds That the Nearest Quasar Is Powered by a Double Black Hole


NASA - Hubble Space Telescope patch.

Aug. 27, 2015

Astronomers using NASA’s Hubble Space Telescope have found that Markarian 231 (Mrk 231), the nearest galaxy to Earth that hosts a quasar, is powered by two central black holes furiously whirling about each other.


Image above: This artistic illustration is of a binary black hole found in the center of the nearest quasar to Earth, Markarian 231. Image Credits: NASA, ESA, and G. Bacon (STScI).

The finding suggests that quasars—the brilliant cores of active galaxies – may commonly host two central supermassive black holes, which fall into orbit about one another as a result of the merger between two galaxies. Like a pair of whirling skaters, the black-hole duo generates tremendous amounts of energy that makes the core of the host galaxy outshine the glow of its population of billions of stars, which scientists then identify as quasars.

Scientists looked at Hubble archival observations of ultraviolet radiation emitted from the center of Mrk 231 to discover what they describe as “extreme and surprising properties.”

If only one black hole were present in the center of the quasar, the whole accretion disk made of surrounding hot gas would glow in ultraviolet rays. Instead, the ultraviolet glow of the dusty disk abruptly drops off toward the center. This provides observational evidence that the disk has a big donut hole encircling the central black hole. The best explanation for the donut hole in the disk, based on dynamical models, is that the center of the disk is carved out by the action of two black holes orbiting each other. The second, smaller black hole orbits in the inner edge of the accretion disk, and has its own mini-disk with an ultraviolet glow.

“We are extremely excited about this finding because it not only shows the existence of a close binary black hole in Mrk 231, but also paves a new way to systematically search binary black holes via the nature of their ultraviolet light emission,” said Youjun Lu of the National Astronomical Observatories of China, Chinese Academy of Sciences.

“The structure of our universe, such as those giant galaxies and clusters of galaxies, grows by merging smaller systems into larger ones, and binary black holes are natural consequences of these mergers of galaxies,” added co-investigator Xinyu Dai of the University of Oklahoma.

The central black hole is estimated to be 150 million times the mass of our sun, and the companion weighs in at 4 million solar masses. The dynamic duo completes an orbit around each other every 1.2 years.

Hubble orbiting Earth

The lower-mass black hole is the remnant of a smaller galaxy that merged with Mrk 231. Evidence of a recent merger comes from the host galaxy’s asymmetry, and the long tidal tails of young blue stars.

The result of the merger has been to make Mrk 231 an energetic starburst galaxy with a star formation rate 100 times greater than that of our Milky Way galaxy. The infalling gas fuels the black holes’ “engine”, triggering outflows and gas turbulence that incites a firestorm of star birth.

The binary black holes are predicted to spiral together and collide within a few hundred thousand years.

Mrk 231 is located 600 million light-years away.

The results were published in the August 14, 2015 edition of The Astrophysical Journal.

The Hubble Space Telescope is a project of international cooperation between NASA and the European Space Agency. NASA's Goddard Space Flight Center in Greenbelt, Maryland, manages the telescope. The Space Telescope Science Institute (STScI) in Baltimore, Maryland, conducts Hubble science operations. STScI is operated for NASA by the Association of Universities for Research in Astronomy, in Washington.

For images and more information about the study and the Hubble Space Telescope, visit: http://www.nasa.gov and http://www.spacetelescope.org/

http://hubblesite.org/news/2015/31

Image (mentioned), Video, Text, Credits: ESA/NASA's Goddard Space Flight Center/Robert Gutro/Karl Hille.

Greetings, Orbiter.ch

mercredi 26 août 2015

LHC progresses towards higher intensities


CERN - European Organization for Nuclear Research logo.

Aug. 26, 2015

As with any particle accelerator designed to explore a new energy frontier, the operators at the Large Hadron Collider (LHC) have to take the machine up to its full operating potential step by step. Following the start of Run 2 at a new record energy in June, the LHC had delivered some 28,000 billion collisions to the large experiments by mid-August. Now it is on its way towards much faster delivery, as the operators work on progressively increasing the intensity of the proton beams in the machine.

The LHC is designed to circulate protons at nearly the speed of light, not in a continuous stream, but in bunches, each containing about 100 billion protons, separated by gaps of 25 nanoseconds (ns). Under these conditions, when the LHC is full, some 2800 bunches of protons will circulate the 27-kilometre accelerator more than 11,000 times per second.

During the LHC's first run, protons collided at energies of up to 8 teraelectronvolts (TeV) in bunches that were spaced apart by 50 ns. Now, the collision energy is 13 TeV and the bunch spacing down to 25 ns.

Ramping up (Image: Maximilien Brice/CERN)

For this new regime, the LHC operations team is now subjecting the accelerator to rigorous testing with stable beams at 25 ns by slowly increasing the intensity. This follows a period of “scrubbing” at 25 ns around the end of July, to release gas molecules trapped in the surfaces of the beam pipes, which give rise to “electron clouds” that can destabilise the proton beam.

"The tests have thrown up several challenges," says Mike Lamont of the LHC Operations team. "For example, with 25 nanoseconds, the electron cloud is more of an issue."

The team is currently increasing the number of proton bunches in the machine, step by step. At each step the machine must run for a total of 20 hours providing stable beams for the experiments, while the operators check that all systems are working properly before stepping up the number of bunches again. The target for this year is about 2300 bunches in the machine, spaced by 25 ns.

This increase in beam intensity means that the accelerator hardware is running closer to its maximum tolerance than during the LHC's first run. The intensity increase has highlighted the need to replace some components in the magnet quench protection system in the next technical stop in early September. Nevertheless the superconducting magnets are behaving well, and the operations team has optimized the injection, ramping and focussing systems since Run 1.

"It’s early days," says Lamont. "We knew that running the accelerator at 13 TeV would be challenging. But 2015 is really a re-commissioning year. Though it may be a short year for proton physics, we're laying the foundations for 2016 and the rest of Run 2.

Note:

CERN, the European Organization for Nuclear Research, is one of the world’s largest and most respected centres for scientific research. Its business is fundamental physics, finding out what the Universe is made of and how it works. At CERN, the world’s largest and most complex scientific instruments are used to study the basic constituents of matter — the fundamental particles. By studying what happens when these particles collide, physicists learn about the laws of Nature.

The instruments used at CERN are particle accelerators and detectors. Accelerators boost beams of particles to high energies before they are made to collide with each other or with stationary targets. Detectors observe and record the results of these collisions.

Founded in 1954, the CERN Laboratory sits astride the Franco–Swiss border near Geneva. It was one of Europe’s first joint ventures and now has 22 Member States.

Related links:

Large Hadron Collider (LHC): http://home.web.cern.ch/topics/large-hadron-collider

“Electron clouds”: http://home.web.cern.ch/about/updates/2015/06/chasing-clouds-lhc

Magnet quench protection system: http://home.web.cern.ch/about/engineering/restarting-lhc-why-13-tev

Superconducting magnets: http://home.web.cern.ch/about/engineering/pulling-together-superconducting-electromagnets

For more information about European Organization for Nuclear Research (CERN), Visit: http://home.web.cern.ch/

Image (mentioned), Text, Credits: CERN/Cian O'Luanaigh.

Best regards, Orbiter.ch

Chandra Data Suggest Giant Collision Triggered “Radio Phoenix”


NASA - Chandra X-ray Observatory patch.

Aug. 26, 2015


Astronomers have found evidence for a faded electron cloud “coming back to life,” much like the mythical phoenix, after two galaxy clusters collided. This “radio phoenix,” so-called because the high-energy electrons radiate primarily at radio frequencies, is found in Abell 1033. The system is located about 1.6 billion light years from Earth. Image Credit: X-ray: NASA/CXC/Univ of Hamburg/F. de Gasperin et al; Optical: SDSS; Radio: NRAO/VLA.

By combining data from NASA’s Chandra X-ray Observatory, the Westerbork Synthesis Radio Telescope in the Netherlands, NSF’s Karl Jansky Very Large Array (VLA), and the Sloan Digital Sky Survey (SDSS), astronomers were able to recreate the scientific narrative behind this intriguing cosmic story of the radio phoenix.

Galaxy clusters are the largest structures in the Universe held together by gravity. They consist of hundreds or even thousands of individual galaxies, unseen dark matter, and huge reservoirs of hot gas that glow in X-ray light. Understanding how clusters grow is critical to tracking how the Universe itself evolves over time.

Astronomers think that the supermassive black hole close to the center of Abell 1033 erupted in the past. Streams of high-energy electrons filled a region hundreds of thousands of light years across and produced a cloud of bright radio emission. This cloud faded over a period of millions of years as the electrons lost energy and the cloud expanded.

The radio phoenix emerged when another cluster of galaxies slammed into the original cluster, sending shock waves through the system. These shock waves, similar to sonic booms produced by supersonic jets, passed through the dormant cloud of electrons. The shock waves compressed the cloud and re-energized the electrons, which caused the cloud to once again shine at radio frequencies.

A new portrait of this radio phoenix is captured in this multiwavelength image of Abell 1033. X-rays from Chandra are in pink and radio data from the VLA are colored green. The background image shows optical observations from the SDSS. A map of the density of galaxies, made from the analysis of optical data, is seen in blue. Mouse over the image to see the location of the radio phoenix.

The Chandra data show hot gas in the clusters, which seems to have been disturbed during the same collision that caused the re-ignition of radio emission in the system. The peak of the X-ray emission is seen to the south (bottom) of the cluster, perhaps because the dense core of gas in the south is being stripped away by surrounding gas as it moves. The cluster in the north may not have entered the collision with a dense core, or perhaps its core was significantly disrupted during the merger. On the left side of the image, a so-called wide-angle tail radio galaxy shines in the radio. The lobes of plasma ejected by the supermassive black hole in its center are bent by the interaction with the cluster gas as the galaxy moves through it.

Astronomers think they are seeing the radio phoenix soon after it had reborn, since these sources fade very quickly when located close to the center of the cluster, as this one is in Abell 1033. Because of the intense density, pressure, and magnetic fields near the center of Abell 1033; a radio phoenix is only expected to last a few tens of millions of years.

Artist concept of Chandra X-ray Observatory. Image Credit: NASA/CXC

A paper describing these results was published in a recent issue of the Monthly Notices of the Royal Astronomical Society and a preprint is available online. The authors are Francesco de Gasperin from the University of Hamburg, Germany; Georgiana Ogrean and Reinout van Weeren from the Harvard-Smithsonian Center for Astrophysics; William Dawson from the Lawrence Livermore National Lab in Livermore, California; Marcus Brüggen and Annalisa Bonafede from the University of Hamburg, Germany, and Aurora Simionescu from the Japan Aerospace Exploration Agency in Sagamihara, Japan.

NASA's Marshall Space Flight Center in Huntsville, Alabama, manages the Chandra program for NASA's Science Mission Directorate in Washington. The Smithsonian Astrophysical Observatory in Cambridge, Massachusetts, controls Chandra's science and flight operations.

Read More from NASA's Chandra X-ray Observatory: http://chandra.harvard.edu/photo/2015/a1033/

For more Chandra images, multimedia and related materials, visit: http://www.nasa.gov/chandra

Images (mentioned), Text, Credits: NASA/Marshall Space Flight Center/Janet Anderson/Chandra X-ray Center/Megan Watzke/Lee Mohon.

Best regards, Orbiter.ch

The wings of the butterfly


ESA . Hubble Space Telescope logo.

26 August 2015

New Hubble image of the Twin Jet Nebula

The Twin Jet Nebula

The shimmering colours visible in this NASA/ESA Hubble Space Telescope image show off the remarkable complexity of the Twin Jet Nebula. The new image highlights the nebula’s shells and its knots of expanding gas in striking detail. Two iridescent lobes of material stretch outwards from a central star system. Within these lobes two huge jets of gas are streaming from the star system at speeds in excess of one million kilometres per hour.

The cosmic butterfly pictured in this NASA/ESA Hubble Space Telescope image goes by many names. It is called the Twin Jet Nebula as well as answering to the slightly less poetic name of PN M2-9.

The night sky around the Twin Jet Nebula (ground-based image)

The M in this name refers to Rudolph Minkowski, a German-American astronomer who discovered the nebula in 1947. The PN, meanwhile, refers to the fact that M2-9 is a planetary nebula. The glowing and expanding shells of gas clearly visible in this image represent the final stages of life for an old star of low to intermediate mass. The star has not only ejected its outer layers, but the exposed remnant core is now illuminating these layers — resulting in a spectacular light show like the one seen here. However, the Twin Jet Nebula is not just any planetary nebula, it is a bipolar nebula.

Ordinary planetary nebulae have one star at their centre, bipolar nebulae have two, in a binary star system. Astronomers have found that the two stars in this pair each have around the same mass as the Sun, ranging from 0.6 to 1.0 solar masses for the smaller star, and from 1.0 to 1.4 solar masses for its larger companion. The larger star is approaching the end of its days and has already ejected its outer layers of gas into space, whereas its partner is further evolved, and is a small white dwarf.

Zooming in on the Twin Jet Nebula

The characteristic shape of the wings of the Twin Jet Nebula is most likely caused by the motion of the two central stars around each other. It is believed that a white dwarf orbits its partner star and thus the ejected gas from the dying star is pulled into two lobes rather than expanding as a uniform sphere. However, astronomers are still debating whether all bipolar nebulae are created by binary stars. Meanwhile the nebula’s wings are still growing and, by measuring their expansion, astronomers have calculated that the nebula was created only 1200 years ago.

Within the wings, starting from the star system and extending horizontally outwards like veins are two faint blue patches. Although these may seem subtle in comparison to the nebula’s rainbow colours, these are actually violent twin jets streaming out into space, at speeds in excess of one million kilometres per hour. This is a phenomenon that is another consequence of the binary system at the heart of the nebula. These jets slowly change their orientation, precessing across the lobes as they are pulled by the wayward gravity of the binary system.

Panning across the Twin Jet Nebula

The two stars at the heart of the nebula circle one another roughly every 100 years. This rotation not only creates the wings of the butterfly and the two jets, it also allows the white dwarf to strip gas from its larger companion, which then forms a large disc of material around the stars, extending out as far as 15 times the orbit of Pluto! Even though this disc is of incredible size, it is much too small to be seen on the image taken by Hubble.

An earlier image of the Twin Jet Nebula using data gathered by Hubble’s Wide Field Planetary Camera 2 was released in 1997. This newer version incorporates more recent observations from the telescope’s Space Telescope Imaging Spectrograph (STIS).

A version of this image was entered into the Hubble’s Hidden Treasures image processing competition, submitted by contestant Judy Schmidt.

Notes:

The Hubble Space Telescope is a project of international cooperation between ESA and NASA.

Links:
Images of Hubble: http://www.spacetelescope.org/images/archive/category/spacecraft/

PN M2-9 image from 1997: http://www.spacetelescope.org/images/opo9738a/

Judy Schmidt’s image on Flickr: https://www.flickr.com/photos/geckzilla/9732993912/

Hubblecast 86: The wings of the Twin Jet Nebula: http://www.spacetelescope.org/videos/heic1518a/

Related links:

Hubble’s Wide Field Planetary Camera 2: http://www.spacetelescope.org/about/general/instruments/wfpc2/

Space Telescope Imaging Spectrograph (STIS): http://www.spacetelescope.org/about/general/instruments/stis/

Images, Text, Credits: ESA/Hubble & NASA/Acknowledgement: Judy Schmidt/Digitized Sky Survey 2/Videos: NASA & ESA.

Greetings, Orbiter.ch

mardi 25 août 2015

Soyuz Move Sets Stage for Arrival of New Space Station Crew


ROSCOSMOS - Soyuz TMA-16M Mission patch.

Aug. 25, 2015

Half of the residents of the International Space Station will take a spin around their orbital neighborhood in the Soyuz TMA-16M spacecraft on Friday, Aug. 28. NASA Television coverage will begin at 2:45 a.m. EDT.

Expedition 44 Commander Gennady Padalka of the Russian Federal Space Agency (Roscosmos) and Flight Engineers Scott Kelly of NASA and Mikhail Kornienko of Roscosmos will move the Soyuz from the station’s Poisk module to the Zvezda docking port. The relocation maneuver will begin with undocking at 3:12 a.m. and end with redocking at 3:37 a.m.


Image above: The Soyuz TMA-08M spacecraft departs from the International Space Station's Poisk Mini-Research Module 2 (MRM2) and heads toward a landing in a remote area near the town of Zhezkazgan, Kazakhstan, on Sept. 11, 2013 (Kazakhstan time). On Friday Aug. 28, 2015, Expedition 44 crew will move the Soyuz TMA-16M spacecraft from the Poisk module to the Zvezda docking port. Image Credits: NASA.

The relocation will free up the Poisk module for the docking of a new Soyuz vehicle, designated TMA-18M, carrying three additional crew members, and scheduled to launch to the station Wednesday, Sept. 2 from the Baikonur Cosmodrome in Kazakhstan. Aboard will be Expedition 45 crew member Sergei Volkov of Roscosmos, and visiting crew members Andreas Mogensen of ESA (European Space Agency) and Aidyn Aimbetov of the Kazakh Space Agency.

Mogensen and Aimbetov will return to Earth with Padalka on Saturday, Sept. 12 in the Soyuz TMA-16M. In March 2016, the Soyuz TMA-18M will return with Volkov, as well as one-year mission crew members Kelly and Kornienko, who arrived on station in March  to begin collecting biomedical data crucial to NASA’s human journey to Mars.

For NASA TV streaming video, schedule and downlink information, visit: http://www.nasa.gov/nasatv

For more information about the International Space Station, visit: http://www.nasa.gov/station

One-year mission Crew: http://www.nasa.gov/content/one-year-crew

Image (mentioned), Text, Credits: NASA/Kathryn Hambleton/Johnson Space Cente/Dan Huot/Gina Anderson.

Best regards, Orbiter.ch

IRIS and Hinode: A Stellar Research Team


NASA - IRIS Mission patch / NASA/JAXA - Hinode X-ray Telescope logo.

Aug. 25, 2015


Image above: This image taken on Oct. 19, 2013, shows a filament on the sun – a giant ribbon of relatively cool solar material threading through the sun's atmosphere, the corona. The individual threads that make up the filament are clearly discernible in this photo. This image was captured by the Solar Optical Telescope onboard JAXA/NASA’s Hinode solar observatory. Researchers studied this filament to learn more about material gets heated in the corona. Image Credits: JAXA/NASA/Hinode.

Modern telescopes and satellites have helped us measure the blazing hot temperatures of the sun from afar. Mostly the temperatures follow a clear pattern: The sun produces energy by fusing hydrogen in its core, so the layers surrounding the core generally get cooler as you move outwards—with one exception. Two NASA missions have just made a significant step towards understanding why the corona—the outermost, wispy layer of the sun's atmosphere —is hundreds of times hotter than the lower photosphere, which is the sun’s visible surface.

In a pair of papers in The Astrophysical Journal, published on August 10, 2015, researchers—led by Joten Okamoto of Nagoya University in Japan and Patrick Antolin of the National Astronomical Observatory of Japan—observed a long-hypothesized mechanism for coronal heating, in which magnetic waves are converted into heat energy. Past papers have suggested that magnetic waves in the sun -- Alfvénic waves – have enough energy to heat up the corona. The question has been how that energy is converted to heat.

"For over 30 years scientists hypothesized a mechanism for how these waves heat the plasma," said Antolin. "An essential part of this process is called resonant absorption  -- and we have now directly observed resonant absorption for the first time."

Resonant absorption is a complicated wave process in which repeated waves add energy to the solar material, a charged gas known as plasma, the same way that a perfectly-timed repeated push on a swing can make it go higher. Resonant absorption has signatures that can be seen in material moving side to side and front to back.

Interface Region Imaging Spectrograph, or IRIS spacecraft. Image Credit: NASA

To see the full range of motions, the team used observations from NASA’s Interface Region Imaging Spectrograph, or IRIS, and the Japan Aerospace Exploration Agency (JAXA)/NASA’s Hinode solar observatory to successfully identify signatures of the process. The researchers then correlated the signatures to material being heated to nearly corona-level temperatures. These observations told researchers that a certain type of plasma wave was being converted into a more turbulent type of motion, leading to lots of friction and electric currents, heating the solar material.

The researchers focused on a solar feature called a filament. Filaments are huge tubes of relatively cool plasma held high up in the corona by magnetic fields. Researchers developed a computer model of how the material inside filament tubes moves, then looked for signatures of these motions with sun-observing satellites.

“Through numerical simulations, we show that the observed characteristic motion matches well what is expected from resonant absorption,” said Antolin.

The signatures of these motions appear in three dimensions, making them difficult to observe without the teamwork of several missions. Hinode’s Solar Optical Telescope was used to make measurements of motions that appear, from our perspective, to be up-and-down or side-to-side, a perspective that scientists call plane-of-sky. The resonant absorption model relies on the fact that the plasma contained in a filament tube moves in a specific wave motion called an Alfvénic kink wave, caused by magnetic fields. Alfvénic kink waves in filaments can cause motions in the plane-of-sky, so evidence of these waves came from observations by Hinode’s extremely high-resolution optical telescope.


Image above: A filament stretches across the lower half of the sun in this image captured by NASA’s Solar Dynamics Observatory on Feb. 10, 2015. Filaments are huge tubes of relatively cool solar material held high up in the corona by magnetic fields. Researchers simulated how the material moves in filament threads to explore how a particular type of motion could contribute to the extremely hot temperatures in the sun’s upper atmosphere, the corona. Image Credits: NASA/SDO.

More complicated were the line-of-sight observations—line-of-sight means motions in the third dimension, toward and away from us. The resonant absorption process can convert the Alfvénic kink wave into another Alfvénic wave motion. To see this conversion process we need to simultaneously observe motions in the plane-of-the-sky and the line-of-sight direction. This is where IRIS comes in. IRIS takes a special type of data called spectra. For each image taken by IRIS’s ultraviolet telescope, it also creates a spectrum, which breaks down the light from the image into different wavelengths.

Analyzing separate wavelengths can provide scientists with additional details such as whether the material is moving toward or away from the viewer. Much like a siren moving toward you sounds different from one moving away, light waves can become stretched or compressed if their source is moving toward or away from an observer. This slight change in wavelength is known as the Doppler effect. Scientists combined their knowledge of the Doppler effect with the expected emissions from a stationary filament to deduce how the filaments were moving in the line-of-sight.

Hinode solar observatory spacecraft. Image Credits: NASA/JAXA

“It’s the combination of high-resolution observations in all three regimes—time, spatial, and spectral—that enabled us to see these previously unresolved phenomena,” said Adrian Daw, mission scientist for IRIS at NASA’s Goddard Space Flight Center in Greenbelt, Maryland.

Using both the plane-of-sky observations from Hinode and line-of-sight observations from IRIS, researchers discovered the characteristic wave motions consistent with their model of this possible coronal heating mechanism. What's more, they also observed material heating up in conjunction with the wave motions, further confirming that this process is related to heating in the solar atmosphere.

“We would see the filament thread disappear from the filter that is sensitive to cool plasma and reappear in a filter for hotter plasma,” said Bart De Pontieu, science lead for IRIS at Lockheed Martin Solar and Astrophysics Lab in Palo Alto, California.


Animation above: This is a simulation of a cross-section of a thread of solar material, called a filament, hovering in the sun's atmosphere. The yellow area is the thread itself, where the material is denser, and the black area is the surrounding, less dense material. The characteristic wave motion leads to complex turbulence around the edges of the yellow thread, which heats the surrounding black material. This model was created with the Aterui supercomputer at the Center for Computational Astrophysics at the National Astronomical Observatory of Japan. Animation Credits: NAOJ/Patrick Antolin.

In addition, comparison of the two wave motions, showed a time delay, known as a phase difference. The researchers’ model predicted this phase difference, thus providing some of the strongest evidence that the team was correctly understanding their observations.

Though resonant absorption plays a key role in the complete process, it does not directly cause heating. The researchers’ simulation showed that the transformed wave motions lead to turbulence around the edges of the filament tubes, which heats the surrounding plasma.

It seems that resonant absorption is an excellent candidate for the role of an energy transport mechanism—though these observations were taken in the transition region rather than the corona, researchers believe that this mechanism could be common in the corona as well.

“Now the work starts to study if this mechanism also plays a role in heating plasma to coronal temperatures,” said De Pontieu.

With the launch of over a dozen missions in the past twenty years, our understanding of the sun and how it interacts with Earth and the solar system is better than at any time in human history. Heliophysics System Observatory missions are working together to unravel the coronal heating problem and the sun’s other remaining mysteries.

Led by the Japan Aerospace Exploration Agency, the Hinode mission is a collaboration between the space agencies of Japan, the United States, the United Kingdom and Europe. IRIS is a NASA Small Explorer; NASA Goddard manages the Explorer Program for NASA's Science Mission Directorate in Washington. Lockheed Martin designed the IRIS observatory and manages the mission for NASA.

Related Links:

For more on IRIS: http://www.nasa.gov/iris

For more on Hinode: http://www.nasa.gov/hinode

JAXA - Solar Physics Satellite "HINODE" (SOLAR-B): http://global.jaxa.jp/projects/sat/solar_b/

Images (mentioned, Animation (mentioned), Text, Credits: NASA’s Goddard Space Flight Center/Sarah Frazier/Holly Zell.

Greetings, Orbiter.ch

Crew Begins Unloading Japanese Cargo Ship


ISS - Expedition 44 Mission patch.

August 25, 2015

The crew opened the hatches today to Japan’s fifth “Kounotori” resupply ship (HTV-5) and began unloading new supplies and science gear. The station residents also studied human research and reviewed changes to emergency procedures.


Image above: Astronaut Kimiya Yui seemingly juggles fresh fruit upside down after opening the hatches and entering Japan’s fifth “Kounotori” resupply ship. Image Credit: NASA TV.

The HTV-5 arrived Monday morning carrying cargo and science for the crew and external experiments to be attached to the Kibo laboratory module. The external research gear includes the CALET dark matter study, the NanoRacks External Platform and a flock of 14 CubeSats.

One-Year crew members Scott Kelly and Mikhail Kornienko are 151 days into their mission. The duo participated in research today looking at the long-term effects of microgravity on the human body. They collected blood and urine samples for the Fluid Shifts study which observes physical changes to an astronaut’s eyes during a space mission.

Related links:

CALET dark matter study: http://www.nasa.gov/mission_pages/station/research/experiments/1074.html

NanoRacks External Platform: http://nanoracks.com/products/external-platform/

Fluid Shifts study: http://www.nasa.gov/mission_pages/station/research/experiments/1257.html

CubeSats: https://www.nasa.gov/mission_pages/station/research/news/flock_1/

For more information on the International Space Station and its crews, visit: http://www.nasa.gov/station

Image (mentioned), Text, Credit: NASA.

Greetings, Orbiter.ch

Dawn Sends Sharper Scenes from Ceres


NASA - Dawn Mission patch.

Aug. 25, 2015


Image above: NASA's Dawn spacecraft spotted this tall, conical mountain on Ceres from a distance of 915 miles (1,470 kilometers). The mountain, located in the southern hemisphere, stands 4 miles (6 kilometers) high. Its perimeter is sharply defined, with almost no accumulated debris at the base of the brightly streaked slope. Image Credits: NASA/JPL-Caltech/UCLA/MPS/DLR/IDA.

The closest-yet views of Ceres, delivered by NASA's Dawn spacecraft, show the small world's features in unprecedented detail, including Ceres' tall, conical mountain; crater formation features and narrow, braided fractures.

"Dawn is performing flawlessly in this new orbit as it conducts its ambitious exploration. The spacecraft's view is now three times as sharp as in its previous mapping orbit, revealing exciting new details of this intriguing dwarf planet," said Marc Rayman, Dawn's chief engineer and mission director, based at NASA's Jet Propulsion Laboratory, Pasadena, California.


Image above: NASA's Dawn spacecraft took this image that shows a mountain ridge, near lower left, that lies in the center of Urvara crater on Ceres. Image Credits: NASA/JPL-Caltech/UCLA/MPS/DLR/IDA.

At its current orbital altitude of 915 miles (1,470 kilometers), Dawn takes 11 days to capture and return images of Ceres' whole surface. Each 11-day cycle consists of 14 orbits. Over the next two months, the spacecraft will map the entirety of Ceres six times.

The spacecraft is using its framing camera to extensively map the surface, enabling 3-D modeling. Every image from this orbit has a resolution of 450 feet (140 meters) per pixel, and covers less than 1 percent of the surface of Ceres.

At the same time, Dawn's visible and infrared mapping spectrometer is collecting data that will give scientists a better understanding of the minerals found on Ceres' surface.


Image above: NASA's Dawn Spacecraft took this image of Gaue crater, the large crater on the bottom, on Ceres. Gaue is a Germanic goddess to whom offerings are made in harvesting rye. Image Credits: NASA/JPL-Caltech/UCLA/MPS/DLR/IDA.

Engineers and scientists will also refine their measurements of Ceres' gravity field, which will help mission planners in designing Dawn's next orbit -- its lowest -- as well as the journey to get there. In late October, Dawn will begin spiraling toward this final orbit, which will be at an altitude of 230 miles (375 kilometers).

Dawn is the first mission to visit a dwarf planet, and the first to orbit two distinct solar system targets. It orbited protoplanet Vesta for 14 months in 2011 and 2012, and arrived at Ceres on March 6, 2015.

Dawn's mission is managed by JPL for NASA's Science Mission Directorate in Washington. Dawn is a project of the directorate's Discovery Program, managed by NASA's Marshall Space Flight Center in Huntsville, Alabama. UCLA is responsible for overall Dawn mission science. Orbital ATK Inc., in Dulles, Virginia, designed and built the spacecraft. The German Aerospace Center, Max Planck Institute for Solar System Research, Italian Space Agency and Italian National Astrophysical Institute are international partners on the mission team. For a complete list of mission participants, visit: http://dawn.jpl.nasa.gov/mission

More information about Dawn is available at the following sites: http://dawn.jpl.nasa.gov and http://www.nasa.gov/dawn

Images (mentioned), Text, Credits: NASA/JPL/Elizabeth Landau/Tony Greicius.

Best regards, Orbiter.ch

Gaia's first year of scientific observations


ESA - Gaia Mission patch.

25 August 2015

Last Friday, 21 August, ESA’s billion-star surveyor, Gaia, completed its first year of science observations in its main survey mode.

After launch on 19 December 2013 and a six-month long in-orbit commissioning period, the satellite started routine scientific operations on 25 July 2014. Located at the Lagrange point L2, 1.5 million km from Earth, Gaia surveys stars and many other astronomical objects as it spins, observing circular swathes of the sky. By repeatedly measuring the positions of the stars with extraordinary accuracy, Gaia can tease out their distances and motions through the Milky Way galaxy.

Stellar density map

For the first 28 days, Gaia operated in a special scanning mode that sampled great circles on the sky, but always including the ecliptic poles. This meant that the satellite observed the stars in those regions many times, providing an invaluable database for Gaia’s initial calibration.

At the end of that phase, on 21 August 2014, Gaia commenced its main survey operation, employing a scanning law designed to achieve the best possible coverage of the whole sky.

Since the start of its routine phase, the satellite recorded 272 billion positional or astrometric measurements 54.4 billion brightness or photometric data points, and 5.4 billion spectra.

The Gaia team have spent a busy year processing and analysing these data, en route towards the development of Gaia’s main scientific products, consisting of enormous public catalogues of the positions, distances, motions and other properties of more than a billion stars. Because of the immense volumes of data and their complex nature, this requires a huge effort from expert scientists and software developers distributed across Europe, combined in Gaia’s Data Processing and Analysis Consortium (DPAC).

“The past twelve months have been very intense, but we are getting to grips with the data, and are looking forward to the next four years of nominal operations,” says Timo Prusti, Gaia project scientist at ESA.

“We are just a year away from Gaia's first scheduled data release, an intermediate catalogue planned for the summer of 2016. With the first year of data in our hands, we are now halfway to this milestone, and we’re able to present a few preliminary snapshots to show that the spacecraft is working well and that the data processing is on the right track.”

Stellar parallax

As one example of the ongoing validation, the Gaia team has been able to measure the parallax for an initial sample of two million stars.

Parallax is the apparent motion of a star against a distant background observed over the period of a year and resulting from the Earth's real motion around the Sun; this is also observed by Gaia as it orbits the Sun alongside Earth. But parallax is not the only movement seen by Gaia: the stars are also really moving through space, which is called proper motion.

Gaia has made an average of roughly 14 measurements of each star on the sky thus far, but this is generally not enough to disentangle the parallax and proper motions.

To overcome this, the scientists have combined Gaia data with positions extracted from the Tycho-2 catalogue, based on data taken between 1989 and 1993 by Gaia's predecessor, the Hipparcos satellite.

This restricts the sample to just two million out of the more than one billion that Gaia has observed so far, but yields some useful early insights into the quality of its data.

The nearer a star is to the Sun, the larger its parallax, and thus the parallax measured for a star can be used to determine its distance. In turn, the distance can be used to convert the apparent brightness of the star into its true brightness or ‘absolute luminosity’.

Gaia's first Hertzsprung-Russell diagram

Astronomers plot the absolute luminosities of stars against their temperatures – which are estimated from the stars' colours – to generate a ‘Hertzsprung-Russell diagram’, named for the two early 20th century scientists who recognised that such a diagram could be used as a tool to understand stellar evolution.

“Our first Hertzsprung-Russell diagram, with absolute luminosities based on Gaia’s first year and the Tycho-2 catalogue, and colour information from ground-based observations, gives us a taste of what the mission will deliver in the coming years,” says Lennart Lindegren, professor at the University of Lund and one of the original proposers of the Gaia mission.

As Gaia has been conducting its repeated scans of the sky to measure the motions of stars, it has also been able to detect whether any of them have changed their brightness, and in doing so, has started to discover some very interesting astronomical objects.

Gaia has detected hundreds of transient sources so far, with a supernova being the very first on 30 August 2014. These detections are routinely shared with the community at large as soon as they are spotted in the form of ‘Science Alerts’, enabling rapid follow-up observations to be made using ground-based telescopes in order to determine their nature.

One transient source was seen undergoing a sudden and dramatic outburst that increased its brightness by a factor of five. It turned out that Gaia had discovered a so-called ‘cataclysmic variable’, a system of two stars in which one, a hot white dwarf, is devouring mass from a normal stellar companion, leading to outbursts of light as the material is swallowed. The system also turned out to be an eclipsing binary, in which the relatively larger normal star passes directly in front of the smaller, but brighter white dwarf, periodically obscuring the latter from view as seen from Earth.

Unusually, both stars in this system seem to have plenty of helium and little hydrogen. Gaia’s discovery data and follow-up observations may help astronomers to understand how the two stars lost their hydrogen.

The Cat's Eye Nebula

Gaia has also discovered a multitude of stars whose brightness undergoes more regular changes over time. Many of these discoveries were made between July and August 2014, as Gaia performed many subsequent observations of a few patches of the sky close to the ecliptic poles. This closely sampled sequence of observations made it possible to find and study variable stars located in these regions.

Located close to the south ecliptic pole is the famous Large Magellanic Cloud (LMC), a dwarf galaxy and close companion of our own galaxy, the Milky Way. Gaia has delivered detailed light curves for dozens of RR Lyrae type variable stars in the LMC, and the fine details revealed in them testify to the very high quality of the data.

Another curious object covered during the same mission phase is the Cat’s Eye Nebula, a planetary nebula also known as NGC 6543, which lies close to the north ecliptic pole.

Planetary nebulae are formed when the outer layers of an aging low-mass star are ejected and interact with the surrounding interstellar medium, leaving behind a compact white dwarf. Gaia made over 200 observations of the Cat’s Eye Nebula, and registered over 84 000 detections that accurately trace out the intricate gaseous filaments that such objects are famous for. As its observations continue, Gaia will be able to see the expansion of the nebular knots in this and other planetary nebulae.

Gaia's asteroid detections

Closer to home, Gaia has detected a wealth of asteroids, the small rocky bodies that populate our solar system, mainly between the orbits of Mars and Jupiter. Because they are relatively nearby and orbiting the Sun, asteroids appear to move against the stars in astronomical images, appearing in one snapshot of a given field, but not in images of the same field taken at later times.

Gaia scientists have developed special software to look for these ‘outliers’, matching them with the orbits of known asteroids in order to remove them from the data being used to study stars. But in turn, this information will be used to characterise known asteroids and to discover thousands of new ones.

Finally, in addition to the astrometric and photometric measurements being made by Gaia, it has been collecting spectra for many stars. The basic use of these data is to determine the motions of the stars along the line-of-sight by measuring slight shifts in the positions of absorption lines in their spectra due to the Doppler shift. But in the spectra of some hot stars, Gaia has also seen absorption lines from gas in foreground interstellar material, which will allow the scientists to measure its distribution.

“These early proof-of-concept studies demonstrate the quality of the data collected with Gaia so far and the capabilities of the processing pipeline. The final data products are not quite ready yet, but we are working hard to provide the first of them to the community next year. Watch this space,” concludes Timo.

About Gaia


Gaia is an ESA mission to survey one billion stars in our galaxy and local galactic neighbourhood in order to build the most precise 3D map of the Milky Way and answer questions about its origin and evolution.

The mission’s primary scientific product will be a catalogue with the positions, motions, brightnesses, and colours of the surveyed stars. An intermediate version of the catalogue will be released in 2016. In the meantime, Gaia's observing strategy, with repeated scans of the entire sky, is allowing the discovery and measurement of many transient events across the sky, which are shared with the community at large in the form of Science Alerts.

The nature of the Gaia mission leads to the acquisition of an enormous quantity of complex, extremely precise data, and the data-processing challenge is a huge task in terms of expertise, effort and dedicated computing power. A large pan-European team of expert scientists and software developers, the Data Processing and Analysis Consortium (DPAC), located in and funded by many ESA member states, is responsible for the processing and validation of Gaia's data, with the final objective of producing the Gaia Catalogue. Scientific exploitation of the data will only take place once they are openly released to the community. 

For more information about Gaia mission, visit: http://www.esa.int/Our_Activities/Space_Science/Gaia

More about...

Gaia overview: http://www.esa.int/Our_Activities/Space_Science/Gaia/Gaia_overview

Gaia factsheet: http://www.esa.int/Our_Activities/Space_Science/Gaia/Gaia_factsheet

Frequently asked questions: http://www.esa.int/Our_Activities/Space_Science/Gaia/Frequently_Asked_Questions_about_Gaia

Gaia brochure: http://www.esa.int/About_Us/ESA_Publications/ESA_BR-296_Gaia_ESA_s_galactic_census

Related articles:

How many stars are there in the Universe?: http://orbiterchspacenews.blogspot.ch/2015/07/counting-stars-with-gaia.html

The billion-pixel camera: http://orbiterchspacenews.blogspot.ch/2011/07/eye-of-gaia-billion-pixel-camera-to-map.html

Images, Text, Credits: ESA/Gaia – CC BY-SA 3.0 IGO/Medialab/DPAC/IDT/FL/DPCE/AGIS/NASA/HEIC/The Hubble Heritage Team/STScI/AURA/DPAC/UB/IEEC/CU4, L. Galluccio, F. Mignard, P. Tanga (Observatoire de la Côte d'Azur).

Greetings, Orbiter.ch

lundi 24 août 2015

Cameras Delivered for NASA’s OSIRIS-REx Mission as Launch Prep Continues


NASA - OSIRIS-REx Mission logo.

Aug. 24, 2015

Artist conception of OSIRIS-REx spacecraft approaching asteroid Bennu. Image Credit: NASA

The first U.S. mission to return samples of an asteroid to Earth is another step closer to its fall 2016 launch, with the delivery of three cameras that will image and map the giant space rock.

A camera suite that will allow NASA’s Origins, Spectral Interpretation, Resource Identification, Security-Regolith Explorer (OSIRIS-REx) mission to see a near-Earth asteroid, map it, and pick a safe and interesting place to touch the surface and collect a sample, has arrived at Lockheed Martin Space Systems in Denver for installation to the spacecraft.

“This is another major step in preparing for our mission,” said Mike Donnelly, OSIRIS-REx project manager at NASA’s Goddard Space Flight Center in Greenbelt, Maryland. “With the delivery of the camera suite to the spacecraft contractor, we will have our full complement of cameras and spectrometers.”

The OSIRIS-REx mission is scheduled to launch in September 2016 to study Bennu, a near-Earth asteroid that’s about one-third of a mile (approximately 500 meters) across. After rendezvousing with Bennu in 2018, the spacecraft will survey the asteroid, obtain a sample, and return it to Earth in 2023.


Image above: The University of Arizona’s camera suite, OCAMS, sits on a test bench that mimics its arrangement on the OSIRIS-REx spacecraft. The three cameras that compose the instrument – MapCam (left), PolyCam and SamCam – are the eyes of NASA’s OSIRIS-REx mission. They will map the asteroid Bennu, help choose a sample site, and ensure that the sample is correctly stowed on the spacecraft. Image Credits: University of Arizona/Symeon Platts.

The three camera instrument suite, known as OCAMS (OSIRIS-REx Camera Suite), was designed and built by the University of Arizona’s Lunar and Planetary Laboratory. The largest of the three cameras, PolyCam, is a small telescope that will acquire the first images of Bennu from a distance of 1.2 million miles (2 million kilometers) and provide high resolution imaging of the sample site. MapCam will search for satellites and dust plumes around Bennu, map the asteroid in color, and provide images to construct topographic maps. SamCam will document the sample acquisition event and the collected sample.

“PolyCam, MapCam and SamCam will be our mission’s eyes at Bennu,” said Dante Lauretta, principal investigator for OSIRIS-REx at the University of Arizona, Tucson. “OCAMS will provide the imagery we need to complete our mission while the spacecraft is at the asteroid.”

OSIRIS-REx is the first U.S. mission to sample an asteroid, and will return the largest sample from space since the Apollo lunar missions. Scientists expect that Bennu may hold clues to the origin of the solar system and the source of water and organic molecules that may have seeded life on Earth. OSIRIS-REx’s investigation will inform future efforts to develop a mission to mitigate an impact, should one be required.

"The most important goal of these cameras is to maximize our ability to successfully return a sample,” said OCAMS instrument scientist Bashar Rizk from the University of Arizona, Tucson. “Our mission requires a lot of activities during one trip – navigation, mapping, reconnaissance, sample site selection, and sampling.  While we are there, we need the ability to continuously see what is happening around the asteroid in order to make real-time decisions."

NASA's Goddard Space Flight Center in Greenbelt, Maryland, provides overall mission management, systems engineering and safety and mission assurance for OSIRIS-REx. Dante Lauretta is the mission's principal investigator at the University of Arizona, Tucson. Lockheed Martin Space Systems in Denver is building the spacecraft. OSIRIS-REx is the third mission in NASA's New Frontiers Program. NASA's Marshall Space Flight Center in Huntsville, Alabama, manages New Frontiers for the agency's Science Mission Directorate in Washington.

For more information on OSIRIS-REx visit: http://www.nasa.gov/osiris-rex and http://www.asteroidmission.org

Images (mentioned), Text, Credits: NASA's Goddard Space Flight Center/Nancy Neal Jones/Rob Garner.

Greetings, Orbiter.ch

NASA SDO: Images of a Mid-Level Solar Flare


NASA - Solar Dynamics Observatory (SDO) patch.

Aug. 24, 2015


Image above: NASA's Solar Dynamics Observatory captured this image of a mid-level solar flare on the sun – as seen in the bright spot in the lower center of the solar disk on Aug. 24, 2015. The image shows a subset of extreme ultraviolet light that highlights the extremely hot solar material, which is typically colorized in red. Image Credits: NASA/SDO.

The sun emitted a mid-level solar flare, peaking at 3:33 a.m EDT on Aug. 24, 2015. NASA’s Solar Dynamics Observatory, which watches the sun constantly, captured an image of the event. Solar flares are powerful bursts of radiation. Harmful radiation from a flare cannot pass through Earth's atmosphere to physically affect humans on the ground, however -- when intense enough -- they can disturb the atmosphere in the layer where GPS and communications signals travel.

 NASA's Solar Dynamics Observatory spacecraft. Image Credit: NASA

To see how this event may affect Earth, please visit NOAA's Space Weather Prediction Center at http://spaceweather.gov, the U.S. government's official source for space weather forecasts, alerts, watches and warnings.

This flare is classified as an M 5.6 class flare. M-class flares are a tenth the size of the most intense flares, the X-class flares. The number provides more information about its strength. An M2 is twice as intense as an M1, an M3 is three times as intense, etc.

Updates will be provided as needed.

What is a solar flare?

For answers to this and other space weather questions, please visit the Spaceweather Frequently Asked Questions page: http://www.nasa.gov/mission_pages/sunearth/spaceweather/index.html

Related Links:

View Past Solar Activity: http://www.nasa.gov/mission_pages/sunearth/solar-events-news/index.html

For more information about Solar Dynamics Observatory (SDO), visit: http://www.nasa.gov/mission_pages/sdo/main/index.html

Image (mentioned), Text, Credits: NASA's Goddard Space Flight Center/Karen C. Fox.

Greetings, Orbiter.ch

Japan’s Cargo Ship Installed on Station


JAXA - Kounotori 5 H-II Transfer Vehicle (HTV-5) logo.

August 24, 2015


Image above: Japan’s “Kounotori” resupply ship is installed to the Harmony module. Image Credit: NASA TV.

The Japan Aerospace Exploration Agency (JAXA) Kounotori 5 H-II Transfer Vehicle (HTV-5) was bolted into place on the International Space Station’s Earth-facing port of the Harmony module at 10:02 a.m. EDT.

Using the International Space Station’s robotic arm, Canadarm2, Expedition 44 Flight Engineer Kimiya Yui of the Japan Aerospace Exploration Agency (JAXA) successfully captured JAXA’s Kounotori 5 H-II Transfer Vehicle (HTV-5) at 6:28 a.m. EDT. The space station crew and the robotics officer in mission control in Houston will position HTV-5 for berthing to the orbiting laboratory’s Earth-facing port of the Harmony module.


Image above: Canada’s robotic arm has Japan’s fifth “Kounotori” resupply ship captured in its grips. Image Credit: NASA TV.

The spacecraft’s arrival will support the crew members’ research off the Earth to benefit the Earth. The HTV-5 is delivering more than 8,000 pounds of equipment, supplies and experiments in a pressurized cargo compartment. The unpressurized compartment will deliver the 1,400-pound CALorimetric Electron Telescope (CALET) investigation, an astrophysics mission that will search for signatures of dark matter and provide the highest energy direct measurements of the cosmic ray electron spectrum.

Items to be unloaded during HTV-5’s stay at the orbiting outpost include food, crew provisions, supplies, several Cubesats, and the NanoRacks External Platform capable of housing multiple, diverse investigations mounted to the JAXA Japanese External Facility.

Japanese Cargo Ship Arrives at the Space Station

JAXA and NASA teams adjusted the cargo manifest to deliver additional food supplies and critical components lost in the failure of the seventh SpaceX commercial resupply services mission. The delivery will ensure the crew has plenty of food through the end of 2015. HTV-5 is delivering two multifiltration beds that filter contaminants from the station’s water supply, a Fluids Control and Pump Assembly used for urine processing to support water recycling, a Wring Collector used in conjunction with the on-orbit toilet, a Respiratory Support Pack used in space to provide breathing assistance to an astronaut in the event lung function were impaired and space suit support equipment used during spacewalks.

The HTV-5 will spend five weeks attached to the international outpost, then the cargo vehicle will be filled with trash, detached from the station and sent to burn up in Earth’s atmosphere.

Join the conversation on Twitter by following @Space_Station and the hashtag #HTV5. To learn more about all the ways to connect and collaborate with NASA, visit: http://www.nasa.gov/connect

Related article:

Japanese HTV-5 Cargo Mission Launches and Reaches Orbit: http://orbiterchspacenews.blogspot.ch/2015/08/japanese-htv-5-cargo-mission-launches.html

For more information on the International Space Station and its crews, visit: http://www.nasa.gov/station

Related links:

Japan Aerospace Exploration Agency (JAXA): http://global.jaxa.jp/

KOUNOTORI 5 (HTV-5): http://global.jaxa.jp/projects/rockets/htv/

Images (mentioned), Video, Text, Credits: NASA/NASA TV.

Best regards, Orbiter.ch

Best regards, Orbiter.ch

Filamentary cosmic cloud


ESA - Herschel Mission patch.

August 24, 2015

Feathery filaments in Mon R2

Fierce flashes of light ripple through delicate tendrils of gas in this new image, from ESA’s Herschel space observatory, which shows the dramatic heart of a large and dense cosmic cloud known as Mon R2. This cloud lies some 2700 light-years away and is studded with hot, newly-formed stars.

Packed into the bright centre of this region are several hot ‘bubbles’ of ionised hydrogen, associated with newborn stars situated nearby. Here, gas heated to a temperature of 10 000 °C quickly expands outwards, inflating and enlarging over time. Herschel has explored the bubbles in Mon R2, finding them to have grown over the course of 100 000 to 350 000 years.

This process forms bubble-like cavities that lie within the larger Mon R2 cloud. These are known as HII regions and Mon R2 hosts four of them, clustered together in the central blue-white haze of bright light — one at the very centre, two stretching out like butterfly wings to the top left and bottom right, and another sitting just above the centre.

Each is associated with a different hot and luminous B-type star. These stars can be many times the mass of the Sun and usually appear with a blue hue due to their high temperature.

Astronomers have found that the hot bubbles in Mon R2 are enveloped by vast clouds of cold, dense gas, sitting within the filaments that stretch across the frame. In stark contrast to the gas in the hot bubbles, these clouds can be at temperatures as low as –260 °C, just above absolute zero.

This particular cluster of HII regions has been studied as part of the Herschel imaging survey of OB young stellar objects, or HOBYS, programme. This image combines multiple Herschel observations obtained with the PACS and SPIRE cameras and has been processed to highlight the cloud’s clumpy complex of filaments, visible here in great and dramatic detail.

Herschel space observatory

Formore information about ESA’s Herschel space observatory, visit: http://www.esa.int/Our_Activities/Space_Science/Herschel

Related links:

Particular cluster of HII regions: https://www.researchgate.net/publication/280307505_From_forced_collapse_to_H_ii_region_expansion_in_Mon_R2_Envelope_density_structure_and_age_determination_with_Herschel

Herschel imaging survey of OB young stellar objects, or HOBYS programme: http://www.herschel.fr/cea/hobys/en/

Images, Text, Credits: ESA/Herschel/PACS/SPIRE/HOBYS Key Programme consortium.

Greetings, Orbiter.ch