samedi 23 août 2014

Former NASA Astronaut Steven Nagel, Veteran of Four Shuttle Flights, Dies at 67


NASA logo.

August 23, 2014

Former NASA astronaut Steven R. Nagel, who served as a mission specialist on his first space shuttle flight, pilot on his second and commanded his final two, died Aug. 21 after a long illness. He was 67 years old.

After his last shuttle flight, Nagel became deputy director for operations development in the Reliability and Quality Assurance Office at NASA’s Johnson Space Center in Houston. He subsequently served as a research pilot, chief of aviation safety and deputy chief of JSC’s Aircraft Operations Division.

“It will always be my honor to know Steve,” said Brian Kelly, director of Flight Operations.  “He blessed our lives in many ways. His humor, positive approach to life, and constant smile is something we will all cherish. His service to our great nation and NASA is inspirational.”

Nagel was born Oct, 27, 1946, in Canton, Ill. He graduated from Canton Senior High School in 1964. He earned a Bachelor of Science degree in aerospace engineering with high honors from the University of Illinois in 1969 and a Master of Science degree in mechanical engineering from California State University at Fresno, California, in 1978.

Nagel received his commission in 1969 through the Air Force Reserve Officer Training Corps program at the University of Illinois.  He completed pilot training at Laredo Air Force Base, Texas, in February 1970, and then F-100 training at Luke Air Force Base, Arizona. From October 1970 to July 1971, Nagel flew F-100s with the 68th Tactical Fighter Squadron at England Air Force Base, Louisiana.

Nagel served for a year as a T-28 instructor for the Laotian Air Force at Udorn, Thailand. He became A-7D instructor pilot and flight examiner at England Air Force Base, Louisiana. in October 1972. He attended the USAF Test Pilot School at Edwards Air Force Base, California, from February to December 1975.

In January 1976, he was assigned to the 6512th Test Squadron at Edwards.  As a test pilot, he worked on various projects, including the F-4 and  A-7D. He logged more than 12,600 hours flying time, including 9,640 hours in jet aircraft.

Astronaut Steven R. Nagel. Image Credit: NASA.

Nagel became a NASA astronaut in August 1979. Assignments included backup T 38 chase pilot for STS-1; support crew and backup entry spacecraft communicator for STS-2; and support crew and primary entry CAPCOM for STS-3.

He first flew in space as a mission specialist on Discovery’s STS-51G, launched June 17, 1985.  During the flight, the crew deployed three communications satellites, for Mexico, the Arab League and AT&T’s Telstar. They used Discovery’s arm to deploy and 17 hours later retrieve the Spartan x-ray astronomy satellite.

Nagel flew as pilot on Challenger for STS-61A, the West German D-1 Spacelab mission, launched Oct. 30, 1985.  More than 75 scientific experiments were completed in physiological sciences, materials processing, biology and navigation during the 7-day, 44-minute mission.

Nagel commanded STS-37 on his third flight, launched on Atlantis April 5, 1991. During the almost six-day mission, the crew deployed the Gamma Ray Observatory (GRO) to explore gamma ray sources throughout the universe. The flight included two spacewalks by Mission Specialists Jerry L. Ross and Jerome Apt. One was the first successful unscheduled spacewalk, to free a stuck antenna on GRO.

Nagel was commander of STS-55, the German D-2 Spacelab mission on Columbia launched April 26, 1993. The 10-day flight carried 89 experiments in materials processing, life sciences, robotics, technology, astronomy and Earth mapping.

Nagel logged a total of 723 hours in space.

Nagel retired from the Air Force as a colonel Feb. 28, 1995, and formally left the Astronaut Office the next day to join the Safety, Reliability, and Quality Assurance Office at Johnson Space Center.  In September 1996, he moved to the Aircraft Operations Division as a research pilot, chief of aviation safety and deputy division chief.

After retiring from NASA May 31, 2011, he joined the University Of Missouri College of Engineering in Columbia, Missouri. There he served as an instructor in the University’s Mechanical and Aerospace Engineering Department.

His numerous awards include the Air Force Distinguished Flying Cross and the Air Medal with seven Oak Leaf Cluster. For pilot training he received the Commander’s Trophy, the Flying Trophy, the Academic Trophy and the Orville Wright Achievement Award (Order of Daedalians).  He also received the Air Force Meritorious Service Medal.  He earned four NASA Space Flight Medals, two Exceptional Service Medals, an Outstanding Leadership Medal, the AAS Flight Achievement Award, the Outstanding Alumni Award of the University of Illinois, a Distinguished Service Medal, the Distinguished Alumni Award, California State University, Fresno and the Lincoln Laureate of the State of Illinois.

He is survived by his wife, Linda, and two daughters, Lauren and Whitney.

Astronaut Biography - Steve Nagel: http://www.jsc.nasa.gov/Bios/htmlbios/nagel.html

Image (mentioned), Text, Credits: NASA Johnson Space Center / Jenny Knotts.

R.I.P.
Orbiter.ch

vendredi 22 août 2014

38 years from the date of successful completion of the mission "Luna-24"


ROSCOSMOS logo.

22.08.2014

38 years ago, August 22, 1976 the Soviet apparatus "Luna-24" will return to Earth 170 grams of lunar soil. It was then for the first time, data were obtained which suggest that there is water on the Moon.

"Luna-24"

Automatic station "Luna-24" was launched from Baikonur on August 9, 1976 by ​​a four-carrier rocket "Proton-K". The unit arrived at the moon on August 13, and for five days before the descent to the surface in orbit. August 18 was included engine of the platform, and after 6 minutes station "Luna-24" landed at a given point on the surface of the moon - in the southeastern region of the Sea of Crises.

"Luna-24" and "Moon" lander launch return rocket "Luna-24" samples capsule to the Earth

Spacecraft "Moon", intended to return lunar soil samples consisted of three main parts: the landing stage, the take-off stage and returned to Earth capsule. Whole bundle landed on the surface, and soil samples were taken and placed in the returned capsule. Then take-off stage started and brought a capsule to Earth.

"Luna-24" with samples of lunar soil landed on Earth

Return rocket "Luna-24" with samples of lunar soil to Earth launched on 19 August. Duration of return flight was 84 hours. August 22 lander landed 200 km south-east of Surgut. The mission of "Luna-24", from a technical point of view, an outstanding and unprecedented, was fully implemented - the Earth brought a sample of lunar soil as a result of the analysis which was first obtained conclusive evidence of water on the Moon.

ROSCOSMOS Press Release: http://www.federalspace.ru/20866/

Images, Text, Credits: Roscosmos press service / Roscosmos / Translation: Orbiter.ch Aerospace.

Greetings, Orbiter.ch

Mars Rover Team Chooses Not to Drill 'Bonanza King'


NASA - Mars Science Laboratory (MSL) patch.

August 22, 2014

Evaluation of a pale, flat Martian rock as the potential next drilling target for NASA's Curiosity Mars rover determined that the rock was not stable enough for safe drilling.

The rock, called "Bonanza King," moved slightly during the mini-drill activity on Wednesday, at an early stage of this test, when the percussion drill impacted the rock a few times to make an indentation.

Instead of drilling that or any similar rock nearby, the team has decided that Curiosity will resume driving toward its long-term destination on the slopes of a layered mountain. It will take a route skirting the north side of a sandy-floored valley where it turned around two weeks ago.


Image above: This image from the front Hazcam on NASA's Curiosity Mars rover shows the rover's drill in place during a test of whether the rock beneath it, "Bonanza King," would be an acceptable target for drilling to collect a sample. Subsequent analysis showed the rock budged during the Aug. 19, 2014, test. Image Credit: NASA/JPL-Caltech.

"We have decided that the rocks under consideration for drilling, based on the tests we did, are not good candidates for drilling," said Curiosity Project Manager Jim Erickson of NASA's Jet Propulsion Laboratory, Pasadena, California. "Instead of drilling here, we will resume driving toward Mount Sharp."

After the rover team chooses a candidate drilling target, the target is subjected to several tests to check whether it meets criteria for collecting a drilled sample without undue risk to rover hardware. The mission's previous three drilling targets, all at more extensive outcrops, met those criteria.

Bonanza King is on the northeastern end of "Hidden Valley." Earlier this month, Curiosity began driving through the valley, but the rover slipped in the sand more than anticipated.

"After further analysis of the sand, Hidden Valley does not appear to be navigable with the desired degree of confidence," Erickson said. "We will use a route avoiding the worst of the sharp rocks as we drive slightly to the north of Hidden Valley."

The rover has driven about 5.5 miles (8.8 kilometers) since landing inside Gale Crater in August 2012, and has about 2 miles (3 kilometers) remaining to reach an entry point to the slopes of Mount Sharp, in the middle of the crater.

The mission made important discoveries near its landing site during its first year by finding evidence of ancient lake and river environments. The rover's findings indicated that those environments would have provided favorable conditions for microbes to live. NASA's Mars Science Laboratory Project continues to use Curiosity to assess ancient habitable environments and major changes in Martian environmental conditions. The destinations on Mount Sharp offer a series of layers that recorded different chapters in the environmental evolution of early Mars.

JPL, a division of Caltech, built the rover and manages the project for NASA's Science Mission Directorate in Washington.

For more information about Curiosity, visit: http://www.nasa.gov/msl and http://mars.jpl.nasa.gov/msl/

You can follow the mission on Facebook at: http://www.facebook.com/marscuriosity and on Twitter at: http://www.twitter.com/marscuriosity

Image (mentioned), Text, Credits: NASA / JPL / Guy Webster.

Cheers, Orbiter.ch

Voyager Map Details Neptune's Strange Moon Triton


NASA - Voyager 1 & 2 Mission patch.

August 22, 2014

NASA's Voyager 2 spacecraft gave humanity its first glimpse of Neptune and its moon Triton in the summer of 1989. Like an old film, Voyager’s historic footage of Triton has been “restored” and used to construct the best-ever global color map of that strange moon. The map, produced by Paul Schenk, a scientist at the Lunar and Planetary Institute in Houston, has also been used to make a movie recreating that historic Voyager encounter, which took place 25 years ago, on August 25, 1989.

VOYAGER 2 AT TRITON

Video above: The Voyager 2 spacecraft flew by Triton, a moon of Neptune, on August 25, 1989. Paul Schenk, a scientist at the Lunar and Planetary Institute in Houston, used Voyager data to construct this video recreating that exciting encounter. Video Credit: NASA/JPL-Caltech/Lunar & Planetary Institute.

The new Triton map has a resolution of 1,970 feet (600 meters) per pixel. The colors have been enhanced to bring out contrast but are a close approximation to Triton’s natural colors. Voyager’s “eyes” saw in colors slightly different from human eyes, and this map was produced using orange, green and blue filter images.

In 1989, most of the northern hemisphere was in darkness and unseen by Voyager. Because of the speed of Voyager's visit and the slow rotation of Triton, only one hemisphere was seen clearly at close distance. The rest of the surface was either in darkness or seen as blurry markings.

The production of the new Triton map was inspired by anticipation of NASA's New Horizons encounter with Pluto, coming up a little under a year from now. Among the improvements on the map are updates to the accuracy of feature locations, sharpening of feature details by removing some of the blurring effects of the camera, and improved color processing.

Although Triton is a moon of a planet and Pluto is a dwarf planet, Triton serves as a preview of sorts for the upcoming Pluto encounter. Although both bodies originated in the outer solar system, Triton was captured by Neptune and has undergone a radically different thermal history than Pluto. Tidal heating has likely melted the interior of Triton, producing the volcanoes, fractures and other geological features that Voyager saw on that bitterly cold, icy surface.


Image above: The Voyager 2 spacecraft flew by Triton, a moon of Neptune, in the summer of 1989. Paul Schenk, a scientist at the Lunar and Planetary Institute in Houston, used Voyager data to construct the best-ever global color map of Triton. This map has a resolution of 1,970 feet (600 meters) per pixel. Image Credit: NASA/JPL-Caltech/Lunar & Planetary Institute.

Pluto is unlikely to be a copy of Triton, but some of the same types of features may be present. Triton is slightly larger than Pluto, has a very similar internal density and bulk composition, and has the same low-temperature volatiles frozen on its surface. The surface composition of both bodies includes carbon monoxide, carbon dioxide, methane and nitrogen ices.

Voyager also discovered atmospheric plumes on Triton, making it one of the known active bodies in the outer solar system, along with objects such as Jupiter's moon Io and Saturn's moon Enceladus. Scientists will be looking at Pluto next year to see if it will join this list. They will also be looking to see how Pluto and Triton compare and contrast, and how their different histories have shaped the surfaces we see.

Although a fast flyby, New Horizons' Pluto encounter on July 14, 2015, will not be a replay of Voyager but more of a sequel and a reboot, with a new and more technologically advanced spacecraft and, more importantly, a new cast of characters. Those characters are Pluto and its family of five known moons, all of which will be seen up close for the first time next summer.

Voyager 2 spacecraft at Neptune. Image Credit: NASA/JPL-Caltech

Triton may not be a perfect preview of coming attractions, but it serves as a prequel to the cosmic blockbuster expected when New Horizons arrives at Pluto next year.

The new Triton map and movie can be found at: http://www.lpi.usra.edu/icy_moons/

In another historic milestone for the Voyager mission, Aug. 25 also marks the two-year anniversary of Voyager 1 reaching interstellar space.

The Voyager mission is managed by NASA's Jet Propulsion Laboratory, in Pasadena, California, for NASA's Science Mission Directorate at NASA Headquarters in Washington. Caltech manages JPL for NASA. The Johns Hopkins University Applied Physics Laboratory in Laurel, Maryland, manages the New Horizons mission for NASA's SMD.

For more information about the Lunar and Planetary Institute, visit:
http://www.lpi.usra.edu

For more information about Voyager, visit:

http://www.nasa.gov/voyager
http://voyager.jpl.nasa.gov

For more information about New Horizons mission, visit:

http://pluto.jhuapl.edu
http://www.nasa.gov/newhorizons

Images (mentioned), Video (mentioned), Text, Credits: NASA/JPL/Elizabeth Landau/Preston Dyches/Lunar and Planetary Institute/Paul Schenk/Johns Hopkins University Applied Physics Laboratory/Michael Buckley.

Best regards, Orbiter.ch

NASA Scientists Watching, Studying Arctic Changes This Summer


NASA patch.

August 22, 2014

As we near the final month of summer in the Northern Hemisphere, NASA scientists are watching the annual seasonal melting of the Arctic sea ice cover. The floating, frozen cap that stretches across the Arctic Ocean shrinks throughout summer until beginning to regrow, typically around mid-September.

As of Aug. 19, Arctic sea ice covered about 2.31 million square miles. While this is on track to be larger than the record-breaking low year in 2012, the sea ice extent is still well below average for the past 30 years, and continues a trend of sea ice loss in the Arctic. From 1981 to 2010, the average sea ice extent on Aug. 19 was 2.72 million square miles – 18 percent larger than on that same date this year.

AMSR2 Daily Arctic Sea Ice - 2014

Video above: This visualization of the Arctic sea ice cap’s seasonal melting is based on satellite data from the AMSR2 instrument operated by the Japan Aerospace Exploration Agency (JAXA). Video Credit: Cindy Starr, NASA Goddard's Scientific Visualization Studio.

"While this year is not heading toward a record low minimum extent in the Arctic, sea ice is well below normal and continues an overall pattern of decreasing sea ice during summer in the Arctic,” said sea ice scientist Walt Meier, based at NASA’s Goddard Space Flight Center in Greenbelt, Maryland.

While NASA scientists have used satellites to document sea ice changes for more than 40 years, this summer the agency is also flying three airborne research campaigns to observe different aspects of climate-driven change in the Arctic.

JAXA AMSR2 satellite

The ARISE (Arctic Radiation-IceBridge Sea and Ice Experiment) campaign will begin flights later this week from Greenland to measure how changing land and sea ice conditions in the region are affecting the formation of clouds and the exchange of heat from Earth’s surface to space.

For some time scientists at NASA and elsewhere have been concerned about how the retreat of sea ice in summer could affect the climate of the Arctic. This campaign is one of the first to study the interaction between sea ice loss and the Arctic atmosphere.

Arctic Sea Ice on August 3, 2014

The CARVE (Carbon in Arctic Reservoirs Vulnerability Experiment) campaign is making its third year of flights from Fairbanks, Alaska, over vast regions of Alaska to measure the emissions of greenhouse gases being released from thawing tundra and permafrost.

And an offshoot of NASA’s long-running Operation IceBridge, a plane will fly over Alaskan glaciers to measure how much the thickness of those glaciers has changed from previous years.

For news on these campaigns and the status of Arctic sea ice as it progresses toward its annual minimum, watch for updates on http://www.nasa.gov/earth and http://www.nasa.gov/earthrightnow throughout August and September.

Related links:

ARISE: NASA to Investigate Climate Impacts of Arctic Sea Ice Loss: http://orbiterchspacenews.blogspot.com.es/2014/08/nasa-to-investigate-climate-impacts-of.html

CARVE: Is a Sleeping Climate Giant Stirring in the Arctic?: http://www.nasa.gov/topics/earth/features/earth20130610.html

Image, Video, Text, Credits: NASA’s Earth Science News Team / Patrick Lynch / JAXA.

Greetings, Orbiter.ch

Hard work behind ATV’s good, clean cargo delivery


ESA - ATV-5 Georges Lemaître Mission patch.

22 August 2014

As International Space Station crewmen unpack the many cargo bags delivered aboard ESA’s ATV space freighter, they are working with some of the cleanest items – carried within one of the cleanest interiors – yet flown in space.

Any unwanted contaminants on the ATV that docked at the International Space Station on 12 August could impact both the astronauts, who have weakened immune systems as a consequence of spaceflight, and the Station itself.

Ready to start moving

To prevent this, ATV Georges Lemaitre (ATV-5) was built in a clean, sterile environment and was subject to rigorous cleaning to eradicate any unwanted contamination. 

Cleanliness campaigns have been carried out for all five of the spacecraft, with specialists from ESA’s Directorate of Technical and Quality Management working alongside the ATV programme team, Arianespace, Airbus and other ISS partner nations. Procedures have grown more rigorous over time.

Incoming ATV

Workers building and outfitting ATV-5 donned full body ‘bunny suits’, incorporating breathing filters. This is essential because the human body is itself a significant source of contamination. Breath, sweat, shedding hair and skin cells are all potential carriers for unpleasant things. 

Microbial cleaning - preventing hitch-hikers in the galaxy

The Russian Mir space station, at the end of its 15 year lifespan, fell victim to an acid-producing fungus. This affected the plastic, glass and titanium surfaces on board.

To prevent these kinds of events the team in French Guiana regularly exposed containers of nutrient gel in and around the ATV 5 vessel. Working with the Pasteur Institute in nearby Cayenne, they then incubated the gel to measure the microbe colonies that developed on it.

Checking cleanliness of ATV cargo bag

ATV-5 was of course manufactured and packed in cleanroom surroundings, but some bacteria, viruses and fungi inevitably make it through, demanding strict cleaning procedures.

“The disinfection process is carried out using oxygen peroxide (H202)” explains Stéphanie Raffestin, ESA’s microbiologist leading the ATV disinfection team.

“Also widely used in hospitals, H202 has the advantage of rapidly breaking down into hydrogen and water, so there is no chemical residue, and no damage to the equipment it cleans.

'Bioburden' samples from ATV cargo

“Follow-up sampling is then performed to check the disinfection process has been effective – typically it has.”

In addition the team tested all of the cargo bags used to carry the payloads, and whenever any last-minute additions are made, the tests were carried out again, repeating the process.

Controlling particulates – gathering up dust

‘Foreign object debris’ is a term for any small particles or even tinier particulates that could be inside or outside the spacecraft. In advance of launch outside surfaces were cleaned, visually spot-checked then checked again under intense lighting.

Any layer of dust might not have allowed a seal to properly form when it came to docking. Indeed, foreign material might even have interfered with the sensors guiding ATV-5 to dock with the ISS.

Visual inspection of ATV

Larger floating particles, such as those produced by screwing in base plates, had to be monitored because of the inhalation risk or the potential damage they could do to the eyes of astronauts in microgravity. 

Once identified, particulates were removed in various ways, starting from small-scale wiping and vacuuming up to flushing and replacing all the air within the ATV and surrounding launch fairing.

Preparing final inspection

One final cleanliness inspection was carried out before the late-loading vertical ATV hatch was closed for good, in advance of launch. A worker and camera were lowered down on a hoist that had itself been thoroughly cleaned first.

Atmospheric toxicity – a breath of fresh air

All materials other than metals give off fumes over time – think of the distinctive smell of a new car. The problem is, above certain concentrations, these ‘volatile organic compounds’ might actually be hazardous, especially for the astronauts charged with opening the ATV .

“Individual payloads are tested for what we term ‘off-gassing’,” explains Thomas Rohr, overseeing ATV’s air quality effort.

Last ATV liftoff

“The challenge is that while the payloads are compliant individually, all the off-gassing constituents of the entire cargo module may still add up to a slightly unpleasant or unhealthy environment,” adds Thomas.

Once ATV is docked, air toxicity predictions performed on the ground before launch were used to calculate if any risk existed for the crew.

For additional certainty an air scrubber was installed to clean the air for a few hours before the crewmen made their entry.

Related links:

Automated Transfer Vehicle: http://www.esa.int/Our_Activities/Human_Spaceflight/ATV

Materials and Processes: http://www.esa.int/Our_Activities/Space_Engineering/Materials_and_Processes

Materials & Electrical Components Laboratory: http://www.esa.int/Our_Activities/Space_Engineering/Materials_Electrical_Components_Laboratory

Life, Physical Sciences and Life Support Laboratory: http://www.esa.int/Our_Activities/Space_Engineering/Life_Physical_Sciences_and_Life_Support_Laboratory

Planetary protection: preventing microbes hitchhiking to space: http://www.esa.int/Our_Activities/Space_Engineering/Planetary_protection_preventing_microbes_hitchhiking_to_space

ATV blog: http://blogs.esa.int/atv

Images, Text, Credits: ESA/NASA/Roscosmos/O.Artemyev/CNES/Arianespace.

Cheers, Orbiter.ch
Soyuz lifts off from French Guiana with the first fully-operational Galileo spacecrafts


ESA / ARIANESPACE - Soyuz Flight VS09 Mission poster.


August 22, 2014

Soyuz Flight VS09

Soyuz ST carrying Galileo's satellites liftoff. Screenshot by Robert Patterson.

Arianespace’s Soyuz launcher has begun its ninth mission from the Spaceport, carrying the initial two FOC (Full Operational Capability) satellites in Europe’s Galileo navigation system, which are named “Doresa” and “Milena.”

Soyuz is to deploy its passengers on a flight lasting nearly 3 hrs., 48 minutes. The launcher’s Fregat upper stage – which is responsible for carrying out the final orbital maneuvers – will perform two burns separated by a three-hour-plus ballistic phase to reach the targeted deployment point for Flight VS09’s dual-satellite payload.

Galileo liftoff

Named for children who were among the winners of a European Commission painting competition in 2011, Doresa and Milena are the first in a series of 22 Galileo FOC satellites that will be deployed using Arianespace’s workhorse Soyuz and heavy-lift Ariane 5 vehicles.

Galileo constellation

Galileo’s FOC phase is funded by the European Commission, which has designated the European Space Agency as the system’s development and sourcing agent. The prime contractor for these initial two Galileo FOC satellites – which have a mass of 730 kg. each – is OHB System of Germany, with the spacecraft’s navigation payloads supplied by Surrey Satellite Technology Ltd. of the UK.

Related links:

European Commission Galileo website: http://ec.europa.eu/enterprise/policies/satnav/galileo/index_en.htm

European Space Agency’s “Launching Galileo” blog: http://www.esa.int/Our_Activities/Navigation/The_future_-_Galileo/Launching_Galileo

OHB System website: https://www.ohb-system.de/

Surrey Satellite Technology Ltd. website: http://www.sstl.co.uk/

Images, Video, Text, Credits: Arianespace / Arianespace TV / ESA / Robert Patterson.

Best regards, Orbiter.ch

jeudi 21 août 2014

Supernova Seen In Two Lights


NASA - Chandra X-ray Observatory patch / NASA - Spitzer Space Telescope patch / ESA - XMM-Newton Mission patch.

Aug. 21, 2014

Supernova Seen In Two Lights

The destructive results of a mighty supernova explosion reveal themselves in a delicate blend of infrared and X-ray light, as seen in this image from NASA’s Spitzer Space Telescope and Chandra X-Ray Observatory, and the European Space Agency's XMM-Newton.

The bubbly cloud is an irregular shock wave, generated by a supernova that would have been witnessed on Earth 3,700 years ago. The remnant itself, called Puppis A, is around 7,000 light-years away, and the shock wave is about 10 light-years across.

The pastel hues in this image reveal that the infrared and X-ray structures trace each other closely. Warm dust particles are responsible for most of the infrared light wavelengths, assigned red and green colors in this view. Material heated by the supernova’s shock wave emits X-rays, which are colored blue. Regions where the infrared and X-ray emissions blend together take on brighter, more pastel tones.

The shock wave appears to light up as it slams into surrounding clouds of dust and gas that fill the interstellar space in this region.

From the infrared glow, astronomers have found a total quantity of dust in the region equal to about a quarter of the mass of our sun. Data collected from Spitzer’s infrared spectrograph reveal how the shock wave is breaking apart the fragile dust grains that fill the surrounding space.

Supernova explosions forge the heavy elements that can provide the raw material from which future generations of stars and planets will form. Studying how supernova remnants expand into the galaxy and interact with other material provides critical clues into our own origins.

Infrared data from Spitzer’s multiband imaging photometer (MIPS) at wavelengths of 24 and 70 microns are rendered in green and red. X-ray data from XMM-Newton spanning an energy range of 0.3 to 8 kiloelectron volts are shown in blue.

For more information about Spitzer Space Telescope, visit: http://www.spitzer.caltech.edu/

For more information about Chandra X-ray Observatory, visit: http://chandra.harvard.edu/

For more information about XMM-Newton X-ray Observatory, visit: http://sci.esa.int/xmm-newton/

Image, Text, Credits: NASA/ESA/JPL-Caltech/GSFC/IAFE.

Best regards, Orbiter.ch

How the Sun Caused an Aurora This Week


ISS - International Space Station patch / ESA / NASA - SOHO Mission patch.

August 21, 2014

On the evening of Aug. 20, 2014, the International Space Station was flying past North America when it flew over the dazzling, green blue lights of an aurora. On board, astronaut Reid Wiseman captured this image of the aurora, seen from above.


Image above: An aurora dances in the atmosphere on Aug. 20, 2014, as the International Space Station flew over North America. This image was captured by astronaut Reid Wiseman from his vantage point on the ISS. Image Credit: NASA.

This auroral display was due to a giant cloud of gas from the sun – a coronal mass ejection or CME – that collided with Earth's magnetic fields on Aug. 19, 2014, at 1:57 a.m. EDT. This event set off, as it often does, what's called a geomagnetic storm.  This is a kind of space weather event where the magnetic fields surrounding Earth compress and release. This oscillation is much like a spring moving back and forth, but unlike a spring, moving magnetic fields cause an unstable environment, setting charged particles moving and initiating electric currents.


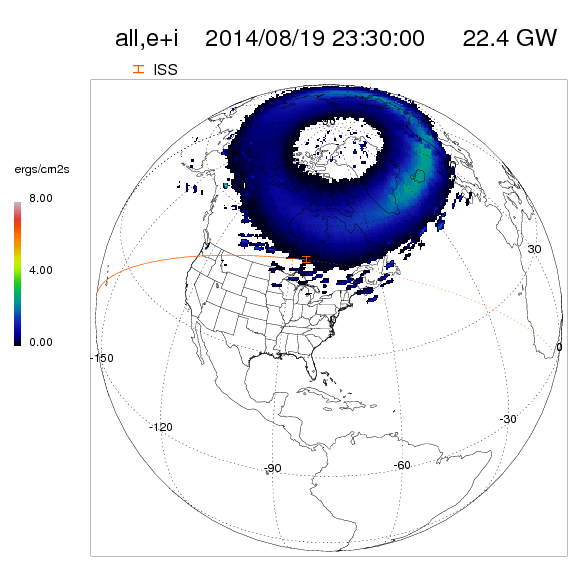
Image above: This model shows where the aurora was visible at 7:30 p.m. EDT on Aug. 19, 2014, as the International Space Station flew over it. The model is an Ovation Prime model and it is available from the Community Coordinated Modeling Center at NASA's Goddard Space Flight Center in Greenbelt, Maryland. Image Credit: NASA/CCMC.

The geomagnetic storm passed within 24 hours or so but, while it was ongoing, the solar particles and magnetic fields caused the release of particles already trapped near Earth.  These, in turn, triggered reactions in the upper atmosphere in which oxygen and nitrogen molecules released photons of light.


Animation above: A coronal mass ejection, or CME, burst from the sun on Aug. 15, 2014. When it arrived at Earth, it sparked aurora over North America. This looping animated GIF of the CME was captured by the Solar and Heliospheric Observatory. The bright planet seen moving toward the left is Mercury. Image Credit: ESA&NASA/SOHO.

The result: an aurora, and a special sight for the astronauts on board the space station.

For more information about the International Space Station (ISS), visit: http://www.nasa.gov/mission_pages/station/main/index.html

For more information about SOHO mission, visit: http://soho.esac.esa.int/ and http://www.nasa.gov/mission_pages/soho/

Images & Animation (mentioned), Text, Credits: NASA's Goddard Space Flight Center / Karen C. Fox.

Cheers, Orbiter.ch

mercredi 20 août 2014

Ice sheet highs, lows and loss


ESA - CryoSat Mission logo.

20 August 2014

Measurements from ESA’s CryoSat mission have been used to map the height of the huge ice sheets that blanket Greenland and Antarctica and show how they are changing. New results reveal combined ice volume loss at an unprecedented rate of 500 cubic kilometres a year.

The research was carried out by Germany’s Alfred Wegener Institute Helmholtz Centre for Polar and Marine Research and the results were published today in The Cryosphere, a European Geosciences Union journal.

Greenland ice-sheet height

The new maps, which incorporate 7.5 million elevation measurements of Greenland and 61 million of Antarctica collected by CryoSat in 2012, are the most complete to date from a single satellite mission.

Lead author Veit Helm said, “The new elevation maps are snapshots of the current state of the ice sheets. They are very accurate and cover close to 16 million sq. km, which is 500 000 sq. km more – about the size of Spain – than previous elevation models from altimetry.”

Greenland ice-sheet change

Reaching latitudes of 88°, CryoSat orbits closer to the poles than earlier missions. It carries SIRAL – a precise radar altimeter that sends out short radar pulses that bounce off the ice surface and back to the satellite. Measuring the time this takes yields the height of the ice.

In fact, SIRAL is the first radar altimeter of its kind to overcome the difficulties intrinsic to measuring icy surfaces. The instrument allows scientists to determine the thickness of ice floating in the oceans and to monitor changes in the vast ice sheets on land, particularly around the edges where icebergs are calved.

Antarctic ice-sheet height

In addition to showing the current highs and lows of the ice sheets, the study also highlights how much ice was lost between January 2011 and January 2014. Ice sheets gain mass through snowfall and lose it through melting and by glaciers that carry ice from the interior to the ocean.

It is important to assess how ice-sheet surface elevation and thickness across Greenland and Antarctica is changing to understand how they are contributing to sea-level rise.

Using an astonishing 200 million data points across Antarctica and 14.3 million across Greenland collected by CryoSat, the team were able to study how the ice sheets changed over the three years.

The resulting maps reveal that Greenland alone is reducing in volume by about 375 cubic kilometres a year.

Antarctic ice-sheet change

The two ice sheets combined are thinning at a rate of 500 cubic kilometres a year, the highest rate observed since altimetry satellite records began about 20 years ago.

The researchers say the ice sheets’ annual contribution to sea-level rise has doubled since 2009.

Glaciologist Angelika Humbert, another of the study’s authors, added, “Since 2009, the volume loss in Greenland has increased by a factor of about two and the West Antarctic Ice Sheet by a factor of three.

Both the West Antarctic Ice Sheet and the Antarctic Peninsula, in the far west, are rapidly losing volume. By contrast, East Antarctica is gaining volume, though at a moderate rate that doesn’t compensate for the losses on the other side of the continent.”

The researchers detected the biggest elevation changes in Jakobshavn Glacier in Greenland, which was recently found to be shifting ice into the oceans faster than any other ice-sheet glacier, and Pine Island Glacier, which like other glaciers in the West Antarctica, has been thinning rapidly in recent years.

Antarctic peninsula ice-sheet change

The study highlights how important CryoSat is for producing height maps, particularly in regions where the surface slopes steeply and elevation changes are more pronounced.

“These areas can be difficult to measure, but SIRAL enabled us to continuously observe the surface of the ice sheets with high precision and dense coverage, better than any previous system,” said Dr Helm.

Mark Drinkwater, ESA’s CryoSat Mission Scientist, noted, “These latest results offer a critical new perspective on the recent impact of climate change on the large ice sheets. 

CryoSat over Greenland

“Whilst CryoSat provides essential continuity in an ice sheet elevation record dating back to ESA’s ERS satellite data from the early 1990s, these results also highlight its design capability to capture regional patterns in the rate of change.

“This is particularly evident in parts of the Antarctic peninsula, where some of the more remarkable features add testimony on the impact of sustained peninsula warming at rates several times the global average.”

Related links:

The Cryosphere: http://www.the-cryosphere.net/

Study: Elevation and elevation change of Greenland and Antarctica derived from CryoSat-2: http://www.the-cryosphere.net/8/1539/2014/tc-8-1539-2014.html

European Geosciences Union: http://www.egu.eu/

Alfred Wegener Institute: http://www.awi.de/en/home/

Access CryoSat data: https://earth.esa.int/web/guest/missions/esa-operational-eo-missions/cryosat

Images, Video, Text, Credits: ESA/Helm et al., The Cryosphere, 2014.

Greetings, Orbiter.ch

A Spectacular Landscape of Star Formation


ESO - European Southern Observatory logo.

20 August 2014

Star formation in the southern Milky Way

This image, captured by the Wide Field Imager at ESO’s La Silla Observatory in Chile, shows two dramatic star formation regions in the southern Milky Way. The first is of these, on the left, is dominated by the star cluster NGC 3603, located 20 000 light-years away, in the Carina–Sagittarius spiral arm of the Milky Way galaxy. The second object, on the right, is a collection of glowing gas clouds known as NGC 3576 that lies only about half as far from Earth.

Star formation regions in the constellation of Carina (The Keel)

NGC 3603 is a very bright star cluster and is famed for having the highest concentration of massive stars that have been discovered in our galaxy so far. At the centre lies a Wolf–Rayet multiple star system, known as HD 97950. Wolf–Rayet stars are at an advanced stage of stellar evolution, and start off with around 20 times the mass of the Sun. But, despite this large mass, Wolf–Rayet stars shed a considerable amount of their matter due to intense stellar winds, which blast the star’s surface material off into space at several million kilometres per hour, a crash diet of cosmic proportions.

Star formation in the constellation of Carina

NGC 3603 is in an area of very active star formation. Stars are born in dark and dusty regions of space, largely hidden from view. But as the very young stars gradually start to shine and clear away their surrounding cocoons of material they become visible and create glowing clouds in the surrounding material, known as HII regions. HII regions shine because of the interaction of ultraviolet radiation given off by the brilliant hot young stars with the hydrogen gas clouds. HII regions can measure several hundred light-years in diameter, and the one surrounding NGC 3603 has the distinction of being the most massive in our galaxy.

Zooming in on star formation in the southern Milky Way

The cluster was first observed by John Herschel on 14 March 1834 during his three-year expedition to systematically survey the southern skies from near Cape Town. He described it as a remarkable object and thought that it might be a globular star cluster. Future studies showed that it is not an old globular, but a young open cluster, one of the richest known.

NGC 3576, on the right of the image, also lies in the Carina–Sagittarius spiral arm of the Milky Way. But it is located only about 9000 light-years from Earth — much closer than NGC 3603, but appearing next to it in the sky.

A close-up look at star formation in the southern Milky Way

NGC 3576 is notable for two huge curved objects resembling the curled horns of a ram. These odd filaments are the result of stellar winds from the hot, young stars within the central regions of the nebula, which have blown the dust and gas outwards across a hundred light-years. Two dark silhouetted areas known as Bok globules are also visible in this vast complex of nebulae. These black clouds near the top of the nebula also offer potential sites for the future formation of new stars.

NGC 3576 was also discovered by John Herschel in 1834, making it a particularly productive and visually rewarding year for the English astronomer.

More information:

ESO is the foremost intergovernmental astronomy organisation in Europe and the world’s most productive ground-based astronomical observatory by far. It is supported by 15 countries: Austria, Belgium, Brazil, the Czech Republic, Denmark, France, Finland, Germany, Italy, the Netherlands, Portugal, Spain, Sweden, Switzerland and the United Kingdom. ESO carries out an ambitious programme focused on the design, construction and operation of powerful ground-based observing facilities enabling astronomers to make important scientific discoveries. ESO also plays a leading role in promoting and organising cooperation in astronomical research. ESO operates three unique world-class observing sites in Chile: La Silla, Paranal and Chajnantor. At Paranal, ESO operates the Very Large Telescope, the world’s most advanced visible-light astronomical observatory and two survey telescopes. VISTA works in the infrared and is the world’s largest survey telescope and the VLT Survey Telescope is the largest telescope designed to exclusively survey the skies in visible light. ESO is the European partner of a revolutionary astronomical telescope ALMA, the largest astronomical project in existence. ESO is currently planning the 39-metre European Extremely Large optical/near-infrared Telescope, the E-ELT, which will become “the world’s biggest eye on the sky”.

Links:

Image of NGC 3603 from the VLT: http://www.eso.org/public/images/eso1005a/

Another view of the NGC 3576 region: http://www.eso.org/public/images/eso1113a/

Photos of the MPG/ESO 2.2-metre telescope: http://www.eso.org/public/images/archive/search/?adv=&subject_name=mpg

Other photos taken with the MPG/ESO 2.2-metre telescope: http://www.eso.org/public/images/archive/search/?adv=&facility=15

Photos of La Silla: http://www.eso.org/public/images/archive/category/lasilla/

Images, Text, Credits: ESO/Richard Hook, G. Beccari/Digitized Sky Survey 2/Videos: ESO/G. Beccari/N. Risinger (skysurvey.org). Music: movetwo.

Best regards, Orbiter.ch

mardi 19 août 2014

CNSA Long March 4B launches Gaofen-2 and BRITE-PL-2


CNSA - China National Space Administration logo.

Aug. 19, 2014

China’s back to launch action with the Tuesday launch of a new high-resolution observation satellite. The Gaofen-2 (GF-2) was launched at 03:15 UTC by a Long March-4B (Chang Zheng-4B) rocket from the LC9 launch complex of the Taiyuan Satellite Launch Center. Also on board was the Polish satellite BRITE-PL-2, also known as “Heweliusz”.

Long March-4B (Chang Zheng-4B) rocket launch

The Gaofen satellites are a series of high-resolution optical Earth observation satellites of China National Space Administration. In English ‘gao fen’ means ‘high resolution’.

The civilian High-Definition Earth Observation Satellite program was proposed in 2006, receiving government approval on the next years and initiated in 2010.

The plan was to launch six Gaofen satellites between 2013 and 2016. The first satellite, Gaofen-1, was launched on April 26, 2013, by the Long March-2D (Y18) from the Jiuquan Satellite Launch Center.

Gaofen satellite series

The main goal of the Gaofen series is to provide near real-time observations for disaster prevention and relief, climate change monitoring, geographical mapping, environment and resource surveying, as well as for precision agriculture support.

The major users of the observation data will be the Ministry of Land and Resources, Ministry of Environmental Protection, and the Ministry of Agriculture.

The BRITE-Poland satellites:

The first scientific satellites to explore the stars that are brighter and hotter than the Sun were developed in Poland during between 2010 and 2012. The project will will be helpful in understanding the internal structure of the biggest stars in our galaxy.

Star oscillation will be investigated with the help of BRITE satellite constellations, designed within the Bright Target Explorer (BRITE) project and developed as the Canadian-Austrian-Polish cooperation.

The satellites will be taking images of the sky with a wide-field camera in order to precisely measure the brightness of the brightest stars.

Polish satellite BRITE-PL-2, also known as “Heweliusz”

Measuring these stars precisely from the Earth’s surface proves to be a difficult task, even though they are easily detectable during a cloudless night. A few hundred (500-800) stars of the Milky Way will be observed during the experiment.

Polish scientists intend to investigate the mechanism of convection, which is the transportation of energy that takes place in the hottest stars. This is an important occurrence in nature that physicists have known for over 100 years, however it does not yet have a mathematical description. The BRITE project will help explain the phenomenon.

For more information about China National Space Administration (CNSA), visit: http://www.cnsa.gov.cn/n615709/cindex.html

Images, Video, Text, Credits: CNSA / NASA Spaceflight.com, Rui C. Barbosa / Gunter Space Page.

Greetings, Orbiter.ch

NASA's RXTE Satellite Decodes the Rhythm of an Unusual Black Hole


NASA - RXTE Mission patch.

August 19, 2014

Astronomers have uncovered rhythmic pulsations from a rare type of black hole 12 million light-years away by sifting through archival data from NASA's Rossi X-ray Timing Explorer (RXTE) satellite.

The signals have helped astronomers identify an unusual midsize black hole called M82 X-1, which is the brightest X-ray source in a galaxy known as Messier 82. Most black holes formed by dying stars are modestly-sized, measuring up to around 25 times the mass of our sun. And most large galaxies harbor monster, or supermassive, black holes that contain tens of thousands of times more mass.

“Between the two extremes of stellar and supermassive black holes, it's a real desert, with only about half a dozen objects whose inferred masses place them in the middle ground," said Tod Strohmayer, an astrophysicist at NASA's Goddard Space Flight Center in Greenbelt, Maryland.

NASA RXTE Satellite Catches the Beat of a Midsize Black Hole

Video above: Explore M82 X-1 and learn more about how astronomers used X-ray fluctuations to determine its status as an intermediate-mass black hole. Image Credit: NASA Goddard Space Flight Center.

Astronomers from Goddard and the University of Maryland, College Park (UMCP) have suspected M82 X-1 of being midsize for at least a decade, but compelling evidence excluding it from being a stellar black hole proved elusive.

"For reasons that are very hard to understand, these objects have resisted standard measurement techniques," said Richard Mushotzky, a professor of astronomy at UMCP.

By going over past RXTE observations, the astronomers found specific changes in brightness that helped them determine M82 X-1 measures around 400 solar masses.

As gas falls toward a black hole, it heats up and emits X-rays.  Variations in X-ray brightness reflect changes occurring in the gas. The most rapid fluctuations happen  near the brink of the black hole’s event horizon, the point beyond which nothing, not even light, can escape.

Astronomers call these rhythmic pulses quasi-periodic oscillations, or QPOs.  For stellar black holes, astronomers have established that the larger the mass, the slower the QPOs, but they could not be sure what they were seeing from M82 X-1 was an extension of this pattern.

"When we study fluctuations in X-rays from many stellar-mass black holes, we see both slow and fast QPOs, but the fast ones often come in pairs with a specific 3:2 rhythmic relationship," explained Dheeraj Pasham, UMCP graduate student. For every three pulses from one member of a QPO pair, its partner pulses twice.

NASA's Rossi X-ray Timing Explorer (RXTE) satellite

By analyzing six years of RXTE data, the team located X-ray variations that reliably repeat about 5.1 and 3.3 times a second, a 3:2 relationship. The combined presence of slow QPOs and a faster pair in a 3:2 rhythm sets a standard scale allowing astronomers to extend proven relationships used to determine the masses of stellar-mass black holes.

The results of the study were published online in the Aug. 17 issue of the journal Nature.

Launched in late 1995 and decommissioned in 2012, RXTE is one of NASA's longest-serving astrophysics missions. Its legacy of unique measurements continues to provide researchers with valuable insights into the extreme environments of neutron stars and black holes.

A new NASA X-ray mission called the Neutron Star Interior Composition Explorer (NICER) is slated for launch to the International Space Station in late 2016. Pasham has identified six potential middle-mass black holes that NICER may be able to explore for similar signals.

For more information, visit: http://www.nasa.gov/topics/universe/index.html

Related Links:

Paper: "A 400-solar-mass black hole in the M82 galaxy":  http://www.nature.com/nature/journal/vaop/ncurrent/full/nature13710.html

Download high-resolution video from NASA Goddard's Science Visualization Studio:  http://svs.gsfc.nasa.gov/vis/a010000

Image, Video, Text, Credits: NASA / Felicia Chou / Goddard Space Flight Center / Lynn Chandler.

Cheers, Orbiter.ch