mercredi 24 avril 2013

Launch of the space rocket Soyuz-U with THC Progress M-19M


ROSCOSMOS - Russian Vehicles patch.

April 24, 2013

 Progress M-19M launch

Carrier rocket Soyuz-U brought transport cargo ship Progress M-19M into orbit, where it is two days to get to the International Space Station (ISS). "There was a cargo ship from the third stage rocket", - stated in the Federal Space Agency.

Launch of the space rocket Soyuz-U with THC Progress M-19M

It is interesting that the "Progress M-19M" will fly to the station is not six o'clock (already flown several ships), but under the old scheme - two days. It is expected that the docking of Progress to the service module Zvezda will happen on Friday, April 26 at 16:26 Moscow time. With the cargo ship to the ISS will be delivered about 2.5 tons of cargo, including fuel to maintain orbit of the station, scientific equipment for the crew, as well as food, water and air for cosmonauts and astronauts.

Progress M-19M schema launch

On the eve of the head of the nutrition department of the Institute of Biomedical Problems, Russian Academy of Sciences Alexander Agureev told Interfax that astronauts receive the products they ordered, as well as fresh fruits and vegetables. "It's apples, grapefruit, oranges, lemons, onions. On request, we send to the station sausages with garlic and chili pepper" - listed Agureev.


Start of Progress M-19M was approved on April 24, so as not to interfere with a satellite launch biological "Bion-M", held on April 19.

ROSCOSMOS Press Release (in Russian): http://www.federalspace.ru/main.php?id=2&nid=20059

Images, Video, Text, Credits: ROSCOSMOS / ROSCOSMOS TV / G. De Chiara, Mars Center / Translation: Orbiter.ch Aerospace.

Greetings, Orbiter.ch

mardi 23 avril 2013

CERN - CMS prepares for the future


CERN - European Organization for Nuclear Research logo.

April 23, 2013


Image above: Disc three, equipped with the muon chambers for the third muon station, was lowered into position in November 2006 (Image: CERN).

While the Large Hadron Collider (LHC) takes a break for its first long shutdown, the CMS collaboration are busy maintaining and consolidating the detector to be sure to handle the collider’s improved performance from 2015 onwards.

The biggest priority for CMS is the tracker performance. The CMS tracking system forms the innermost subdetector and fits snugly round the LHC beampipe. It must withstand an onslaught of some 1010 particles a second and the aggressive field of mixed radiation that this produces.

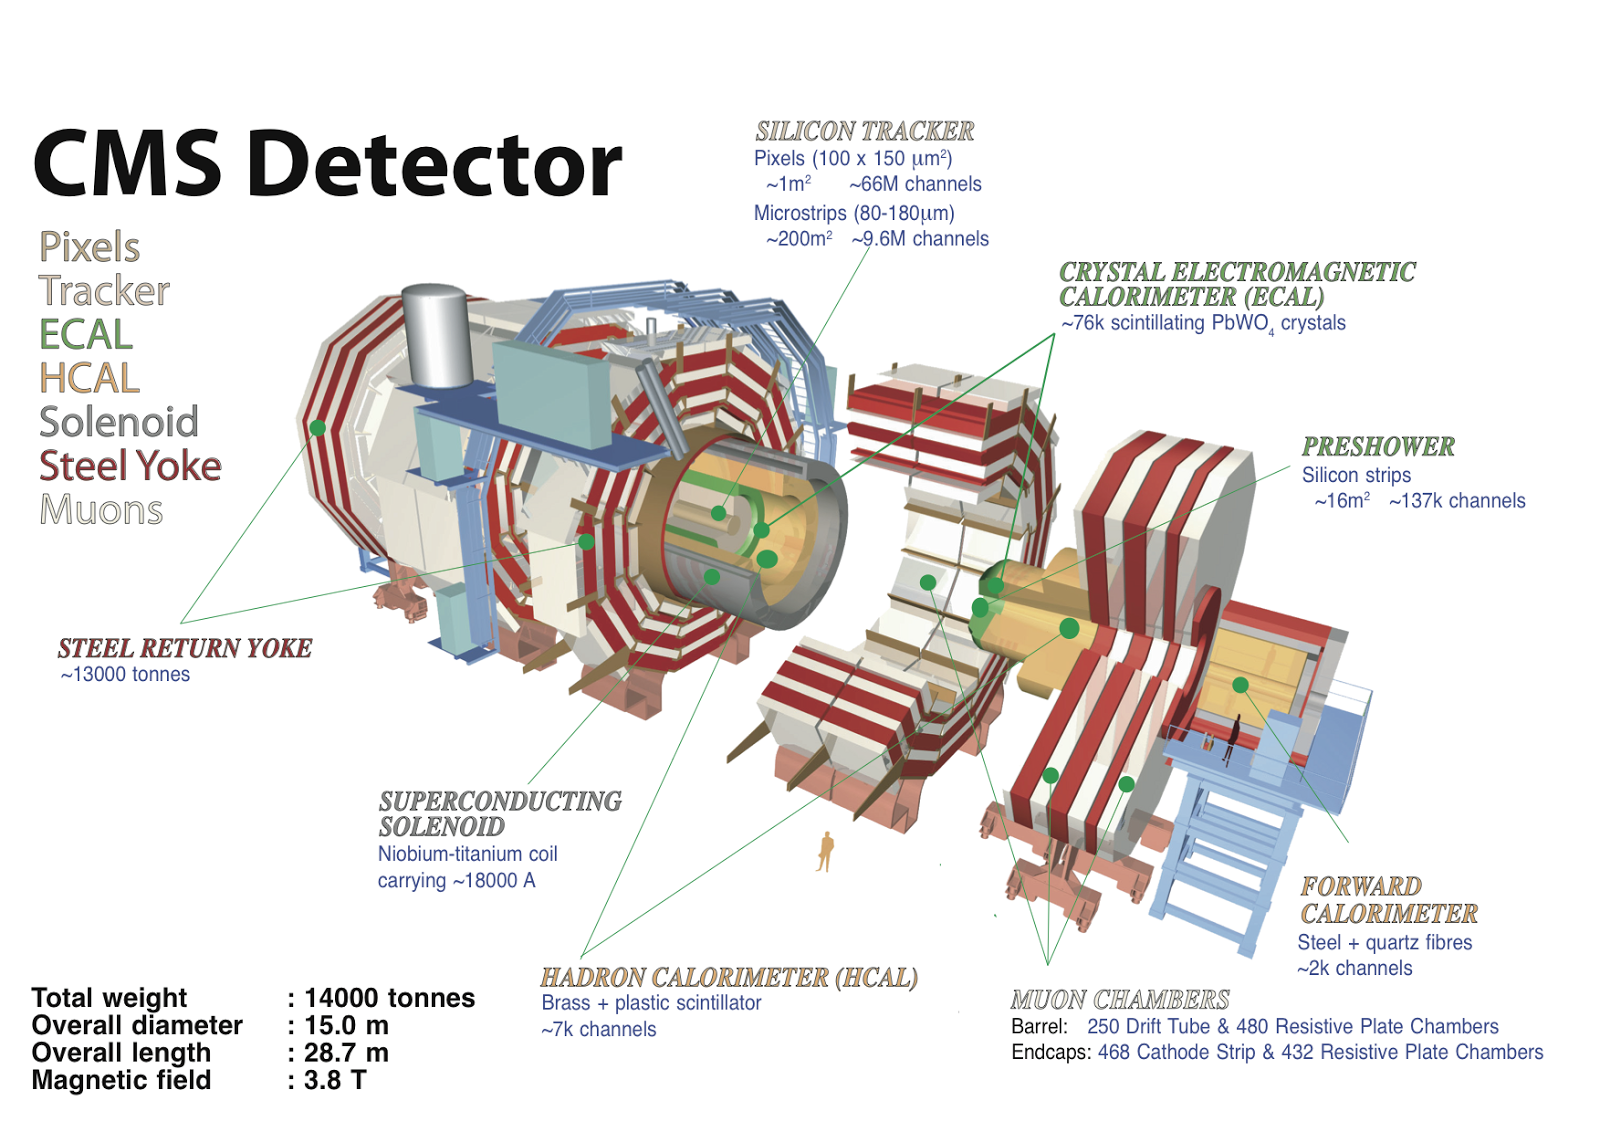
Another major element is to improve the muon detectors with a fourth endcap layer to help discriminate between interesting muons and fake signatures or background. New shielding discs, 10 centimetres deep, are to be installed on either end of the detector. Each shielding disc is made of 12 iron sector-casings filled with a special concrete. The concrete, developed for this specific application by CERN’s civil engineers, is almost 50% denser than normal concrete – it is made using haematite (or ferric oxide) instead of the usual sand – and it is loaded with boron to absorb low-energy neutrons that would otherwise give rise to unwanted hits in the detector.

The CMS detector description (click on the image for enlarge)

The new 100-tonne shielding discs represent the first large mechanical elements of CMS to be constructed entirely underground in the experimental cavern. Each disc will have to be taken apart into its 12 component sectors for lowering and then be rebuilt in a vertical position underground. The shielding discs will have an installed clearance to the new detector layer of around 10–20 millimetres, so it will be a delicate operation and the logical course of action is to install the discs before the detectors.

The schedule for 2013 is planned in fine detail with a list of hundreds of tasks that are currently being translated into day-to-day planning schematics. Amid this important technical work, the CMS collaboration will attempt to welcome around 20,000 visitors to the site at Point 5 over the course of the year. The coming two years might be described as a shutdown period for the LHC and its experiments, but life at Point 5 will be as busy as it has ever been.

This edited extract is from an article in the CERN Courier April issue. Read the full article: http://cerncourier.com/cws/article/cern/52743

Note:

CERN, the European Organization for Nuclear Research, is one of the world’s largest and most respected centres for scientific research. Its business is fundamental physics, finding out what the Universe is made of and how it works. At CERN, the world’s largest and most complex scientific instruments are used to study the basic constituents of matter — the fundamental particles. By studying what happens when these particles collide, physicists learn about the laws of Nature.

The instruments used at CERN are particle accelerators and detectors. Accelerators boost beams of particles to high energies before they are made to collide with each other or with stationary targets. Detectors observe and record the results of these collisions.

Founded in 1954, the CERN Laboratory sits astride the Franco–Swiss border near Geneva. It was one of Europe’s first joint ventures and now has 20 Member States.

Related links:

Large Hadron Collider (LHC): http://home.web.cern.ch/about/accelerators/large-hadron-collider

CMS: http://home.web.cern.ch/about/experiments/cms

Images, Text, Credits: CERN /  Austin Ball, Achintya Rao.

Cheers, Orbiter.ch

Hubble Captures Comet ISON


NASA - Hubble Space Telescope patch.

April 23, 2013


Image above: NASA’s Hubble Space Telescope provides a close-up look of Comet ISON (C/2012 S1), as photographed on April 10, when the comet was slightly closer than Jupiter’s orbit at a distance of 386 million miles from the sun. Credit:NASA, ESA, J.-Y. Li (Planetary Science Institute), and the Hubble Comet ISON Imaging Science Team.

This NASA Hubble Space Telescope image of Comet (C/2012 S1) ISON was photographed on April 10, when the comet was slightly closer than Jupiter’s orbit at a distance of 386 million miles from the Sun (394 million miles from Earth).

Even at that great distance the comet is already active as sunlight warms the surface and causes frozen volatiles to sublimate. A detailed analysis of the dust coma surrounding the solid, icy nucleus reveals a strong, jet blasting dust particles off the sunward-facing side of the comet’s nucleus.

Preliminary measurements from the Hubble images suggest that the nucleus of ISON is no larger than three or four miles across. This is remarkably small considering the high level of activity observed in the comet so far, said researchers. Astronomers are using these images to measure the activity level of this comet and constrain the size of the nucleus, in order to predict the comet’s activity when it skims 700,000 miles above the sun's roiling surface on November 28.

The comet’s dusty coma, or head of the comet, is approximately 3,100 miles across, or 1.2 times the width of Australia. A dust tail extends more than 57,000 miles, far beyond Hubble’s field of view.

More careful analysis is currently underway to improve these measurements and to predict the possible outcome of the sungrazing perihelion passage of this comet.

This image was taken in visible light. The blue false color was added to bring out details in the comet structure.

Hubble Space Telescope. Image credit: NASA / ESA

ISON stands for International Scientific Optical Network, a group of observatories in ten countries who have organized to detect, monitor, and track objects in space. ISON is managed by the Keldysh Institute of Applied Mathematics, part of the Russian Academy of Sciences.

The Hubble Space Telescope is a project of international cooperation between NASA and the European Space Agency. NASA's Goddard Space Flight Center in Greenbelt, Md., manages the telescope. The Space Telescope Science Institute (STScI) in Baltimore, Md., conducts Hubble science operations. STScI is operated by the Association of Universities for Research in Astronomy, Inc., in Washington, D.C.

For more information about Hubble visit:

NASA Hubble sites: http://www.nasa.gov/hubble and http://hubblesite.org/

ESA Hubble site: http://www.spacetelescope.org/

Images (mentioned), Text, Credit: NASA / Space Science Telescope Institute.

Greetings, Orbiter.ch

Three Years of SDO Images


NASA - Solar Dynamics Observatory (SDO) patch.

April 23, 2013

In the three years since it first provided images of the sun in the spring of 2010, NASA’s Solar Dynamics Observatory has had virtually unbroken coverage of the sun's rise toward solar maximum, the peak of solar activity in its regular 11-year cycle. This video shows those three years of the sun at a pace of two images per day.

Three Years of SDO Images

Video Credit: NASA's Goddard Space Flight Center.

SDO’s Atmospheric Imaging Assembly captures a shot of the sun every 12 seconds in 10 different wavelengths. The images shown here are based on a wavelength of 171 angstroms, which is in the extreme ultraviolet range and shows solar material at around 600,000 kelvins (about 1.08 million F). In this wavelength it is easy to see the sun’s 25-day rotation as well as how solar activity has increased over three years.

During the course of the video, the sun subtly increases and decreases in apparent size. This is because the distance between the SDO spacecraft and the sun varies over time. The image is, however, remarkably consistent and stable despite the fact that SDO orbits Earth at 6,876 mph and Earth orbits the sun at 67,062 mph.


Image above: This image is a composite of 25 separate images spanning the period of April 16, 2012, to April 15, 2013. It uses the SDO AIA wavelength of 171 angstroms and reveals the zones on the sun where active regions are most common during this part of the solar cycle. Credit: NASA/SDO/AIA/S. Wiessinger.

Such stability is crucial for scientists, who use SDO to learn more about our closest star. These images have regularly caught solar flares and coronal mass ejections in the act, types of space weather that can send radiation and solar material toward Earth and interfere with satellites in space. SDO’s glimpses into the violent dance on the sun help scientists understand what causes these giant explosions -- with the hopes of some day improving our ability to predict this space weather.

Solar Dynamics Observatory (SDO) spacecraft. Credit: NASA/SDO

For more information about Solar Dynamics Observatory (SDO), visit: http://sdo.gsfc.nasa.gov/ and http://www.nasa.gov/mission_pages/sdo/main/index.html

Images (mentioned), Video (mentioned), Text, Credits: NASA's Goddard Space Flight Center / Karen C. Fox and Scott Wiessinger.

Best regards, Orbiter.ch

Herschel links Jupiter’s water to comet impact


ESA - Herschel Mission patch.

23 April 2013

ESA’s Herschel space observatory has solved a long-standing mystery as to the origin of water in the upper atmosphere of Jupiter, finding conclusive evidence that it was delivered by the dramatic impact of comet Shoemaker-Levy 9 in July 1994.

During the spectacular week-long collision, a string of 21 comet fragments pounded into the southern hemisphere of Jupiter, leaving dark scars in the planet’s atmosphere that persisted for several weeks.

The remarkable event was the first direct observation of an extraterrestrial collision in the Solar System. It was followed worldwide by amateur and professional astronomers with many ground-based telescopes and the NASA/ESA Hubble Space Telescope.

Shoemaker-Levy 9 impact site G

ESA’s Infrared Space Observatory was launched in 1995 and was the first to detect and study water in Jupiter’s upper atmosphere. It was widely speculated that comet Shoemaker-Levy 9 may have been the origin of this water, but direct proof was missing.

Scientists were able to exclude an internal source, such as water rising from deeper within the planet’s atmosphere, because it is not possible for water vapour to pass through the ‘cold trap’ that separates the stratosphere from the visible cloud deck in the troposphere below.

Thus the water in Jupiter’s stratosphere must have been delivered from outside. But determining its origin had to wait more than 15 years, until Herschel used its sensitive infrared eyes to map the vertical and horizontal distribution of water’s chemical signature.

Herschel’s observations found that there was 2–3 times more water in the southern hemisphere of Jupiter than in the northern hemisphere, with most of it concentrated around the sites of the 1994 comet impact. Additionally, it is only found at high altitudes.

 Water in Jupiter’s atmosphere

“Only Herschel was able to provide the sensitive spectral imaging needed to find the missing link between Jupiter’s water and the 1994 impact of comet Shoemaker-Levy 9,” says Thibault Cavalié of the Laboratoire d’Astrophysique de Bordeaux, lead author of the paper published in Astronomy and Astrophysics.

“According to our models, as much as 95% of the water in the stratosphere is due to the comet impact.”

Another possible source of water would be a steady rain of small interplanetary dust particles onto Jupiter. But, in this case, the water should be uniformly distributed across the whole planet and should have filtered down to lower altitudes.

ESA’s Herschel Infrared Space Observatory

Also, one of Jupiter’s icy moons could deliver water to the planet via a giant vapour torus, as Herschel has seen from Saturn’s moon Enceladus, but this too has been ruled out. None of Jupiter’s large moons is in the right place to deliver water to the locations observed.

Finally, the scientists were able to rule out any significant contributions from recent small impacts spotted by amateur astronomers in 2009 and 2010, along with local variations in the temperature of Jupiter’s atmosphere.

Shoemaker-Levy 9 is the only likely culprit.

“All four giant planets in the outer Solar System have water in their atmospheres, but there may be four different scenarios for how they got it,” says Dr Cavalié. “For Jupiter, it is clear that Shoemaker-Levy 9 is by far the dominant source, even if other external sources may contribute also.”

Comet Shoemaker-Levy 9 approaches Jupiter

“Thanks to Herschel’s observations, we have now linked a unique comet impact – one that was followed in real time and which captured the public’s imagination – to Jupiter’s water, finally solving a mystery that has been open for nearly two decades,” adds Göran Pilbratt, ESA’s Herschel project scientist.

The observations made in this study foreshadow those planned for ESA’s future Jupiter Icy moons Explorer mission launching towards the Jovian system in 2022, where it will map the distribution of Jupiter’s atmospheric ingredients in even greater detail.

Notes for Editors:

“The spatial distribution of water in the stratosphere of Jupiter from Herschel-HIFI and –PACS observations,” by T. Cavalié et al. is published in Astronomy & Astrophysics, 553, A21, May 2013.

The observations were obtained under the Herschel Guaranteed Time Key Programme “Water and related chemistry in the Solar System”. HIFI observations were taken in July 2010 and PACS observations were made in October 2009 and December 2010.  The results were complemented with data on the stratospheric temperature of Jupiter taken at NASA’s Infrared Telescope Facility taken during the same period.

Herschel is an ESA space observatory with science instruments provided by European-led Principal Investigator consortia and with important participation from NASA.

Related links:

Herschel: ESA's giant infrared observatory: http://www.esa.int/Our_Activities/Space_Science/Herschel

Online Showcase of Herschel Images OSHI: http://oshi.esa.int/

Herschel operations: http://www.esa.int/Our_Activities/Operations/Herschel_operations

This article in depth: http://sci.esa.int/jump.cfm?oid=51720

Read science paper: http://www.aanda.org/10.1051/0004-6361/201220797

Herschel Science Centre: http://herschel.esac.esa.int/

Images, Text, Credits: ESA / R. Evans, J. Trauger, H. Hammel and the HST Comet Science Team / Water map: ESA/Herschel/T. Cavalié et al.; Jupiter image: NASA/ESA/Reta Beebe (New Mexico State University) / Comet Shoemaker-Levy 9 approaches Jupiter: NASA, ESA, H. Weaver & E. Smith (STScI) and J. Trauger & R. Evans (Jet Propulsion Laboratory).

Best regards, Orbiter.ch

Concept mission to clear a defunct satellite from orbit


ESA - European Space Agency patch.

23 April 2013

 Cleaning space

Artist’s concept showing how a defunct satellite could be grappled for a controlled reentry into Earth’s atmosphere, where it would burn up and be destroyed harmlessly.

This is one of several concepts for clearing dead satellites from orbit being studied by space agencies and industry across Europe.

Hundreds of experts from across the globe are meeting at Europe’s largest-ever debris forum this week to share research findings and discuss potential solutions.

Satellite operators worldwide, including those flying telecom, weather, navigation, broadcast and climate-monitoring missions, are focusing their efforts on controlling space debris.

Scientists estimate the level of space debris orbiting Earth to be around 29 000 objects larger than 10 cm, 670 000 pieces larger than 1 cm and more than 170 million above 1 mm – and any one of these could seriously damage a spacecraft.

Cleaning space above our atmosphere is a strategic goal for ESA.

Background:
   
About debris: http://www.esa.int/Our_Activities/Operations/Space_Debris/Cleaning_space
   
Analysis and prediction: http://www.esa.int/Our_Activities/Operations/Space_Debris/Analysis_and_prediction
    
Scanning & observing: http://www.esa.int/Our_Activities/Operations/Space_Debris/Scanning_observing
   
Re-entry and collision avoidance: http://www.esa.int/Our_Activities/Operations/Space_Debris/Re-entry_and_collision_avoidance
   
Mitigating space debris generation: http://www.esa.int/Our_Activities/Operations/Space_Debris/Mitigating_space_debris_generation
   
Debris removal: http://www.esa.int/Our_Activities/Operations/Space_Debris/Debris_removal
   
Hypervelocity impacts and protecting spacecraft: http://www.esa.int/Our_Activities/Operations/Space_Debris/Hypervelocity_impacts_and_protecting_spacecraft
   
International cooperation: http://www.esa.int/Our_Activities/Operations/Space_Debris/International_cooperation

Images, Text, Credits: ESA / Mixed-Reality Communication GmbH.

Greetings, Orbiter.ch

lundi 22 avril 2013

Taking two bites at ocean salinity?


ESA - SMOS Mission logo / NASA - Aquarius Mission patch.

22 April 2013

The saltiness of the oceans is being closely monitored from space by both ESA’s SMOS and NASA’s Aquarius missions, but in slightly different ways. By joining forces, researchers are exploiting these complementary missions to benefit climate science even further.

Freshwater plume from SMOS (top) Aquarius (bottom)

Everyone knows that seawater is salty, but it isn’t that obvious that the concentration of salt – the salinity – of the surface waters of the world’s oceans varies considerably with location and season.

Salinity is controlled largely by the balance between evaporation and precipitation, so it is an important component of Earth’s water cycle and closely coupled to weather and climate. It is also an important driver in ocean circulation, which in turn, is crucial in moderating the climate.

In fact, ocean salinity is an 'essential climate variable' – a key parameter of climate change.

SMOS in orbit

Until the launch of SMOS in 2009 and Aquarius in 2011, global data on this important variable were simply not available. Scientists need this information to feed into the mathematical models they use to understand the complexities of the exchange processes between Earth’s surfaces and the atmosphere.

Thanks to both missions, these much-needed data are leading to a better understanding of the water cycle, how the ocean works and how salinity is linked to weather and climate.

ESA’s SMOS satellite and NASA’s Aquarius sensor, carried on Argentina’s SAC-D satellite, both use an L-band radiometer to map ocean salinity but offer different resolutions and revisit times.

Salinity from SMOS and Aquarius

For example, Aquarius provides better ‘pixel’ accuracy than SMOS, whereas SMOS provides higher revisit times and spatial resolution.

While it has been shown clearly that their datasets agree and provide similar information, the differences in the data can be exploited to yield even more detail about variations in the salinity of our oceans.

Aquarius in orbit

For instance, the animation above shows the freshwater plume in the Pacific Ocean west of Panama as seen from both missions. This fresh pool is a consequence of heavy summer rains over Central America. Wind is also an important factor in the salinity of the water in this region.

Related links:

SMOS: http://www.esa.int/Our_Activities/Observing_the_Earth/SMOS/

Access SMOS data: http://earth.esa.int/SMOS/

Essential climate variable: http://www.wmo.int/pages/prog/gcos/index.php?name=EssentialClimateVariables

SMOS & Aquarius science workshop: http://www.smosaquarius2013.org/

Aquarius: http://aquarius.nasa.gov/index.html

Ifremer: http://www.salinityremotesensing.ifremer.fr/home

SMAP: http://smap.jpl.nasa.gov/

CONAE: http://www.conae.gov.ar/eng/

Images, Video, Text, Credits: ESA / P. Carril / NASA / IFREMER / ESR.

Best regards, Orbiter.ch