samedi 4 mai 2013

A year ago, a collision was averted between Fermi Gamma-ray Observatory and a oldest soviet spy satellite out of service


Satellite Collision.

May 4, 2013

 Predicted collision on March 29, 2012

NASA scientists provided details this week of how they dodged a 1.5-ton bullet in space last year when they had to fire the thruster engines on the Fermi Gamma-ray Telescope to nudge it out of the way and narrowly avoid a collision with a 26-year-old defunct Soviet-era satellite.

Cosmos 1805 satellite

NASA said it learned of the possible collision on March 29, 2012 when it received an automatically generated report indicating that the $690 million Fermi Space Telescope and the Soviet Cosmos 1805 satellite would pass within 700 feet (213 meters) of each other in a week.

Fermi Gamma-ray Observatory spacecraft

Fermi mission scientists monitored the impending close call and then determined that the two spacecraft would actually pass within 30 milliseconds of each other.

Images, Text, Credits: Voice of Russia / RIA / NASA / Youtube.

Greetings, Orbiter.ch

Sun Emits Mid-Level Flare


NASA - Solar Dynamics Observatory (SDO) patch.

May 4, 2013

The sun emitted a mid-level solar flare, peaking at 1:32 pm EDT on May 3, 2013. Solar flares are powerful bursts of radiation. Harmful radiation from a flare cannot pass through Earth's atmosphere to physically affect humans on the ground, however -- when intense enough -- they can disturb the atmosphere in the layer where GPS and communications signals travel. This disrupts the radio signals for as long as the flare is ongoing, and the radio blackout for this flare has already subsided.


Image above: NASA's Solar Dynamics Observatory captured this image of an M5.7-class flare on May 3, 2013, at 1:30 p.m. EDT. This image shows light in the 131-angstrom wavelength, a wavelength of light that can show material at the very hot temperatures of a solar flare and that is typically colorized in teal. Credit: NASA/SDO/AIA.

This flare is classified as an M5.7-class flare. M-class flares are the weakest flares that can still cause some space weather effects near Earth. Increased numbers of flares are quite common at the moment, as the sun's normal 11-year activity cycle is ramping up toward solar maximum, which is expected in late 2013.


Image above: A burst of solar material leaps off the left side of the sun in what’s known as a prominence eruption. This image combines three images from NASA's Solar Dynamics Observatory captured on May 3, 2013, at 1:45 pm EDT, just as an M-class solar flare from the same region was subsiding. The images include light from the 131-, 171- and 304-angstrom wavelengths. Credit: NASA/SDO/AIA.

Updates will be provided as they are available on the flare and whether there was an associated coronal mass ejection, another solar phenomenon that can send solar particles into space and affect electronic systems in satellites and on Earth.

What is a solar flare?

For answers to these and other space weather questions, please visit the Spaceweather Frequently Asked Questions page: http://www.nasa.gov/mission_pages/sunearth/spaceweather/index.html

Related Links:

View Past Solar Activity: http://www.nasa.gov/mission_pages/sunearth/multimedia/Solar-Events.html

Images (mentioned), Text, Credit: NASA's Goddard Space Flight Center / Karen C. Fox.

Cheers, Orbiter.ch

NASA's Fermi, Swift See 'Shockingly Bright' Burst


NASA - Fermi Gamma-ray Space Telescope logo / NASA - Swift Mission patch.

May 4, 2013

A record-setting blast of gamma rays from a dying star in a distant galaxy has wowed astronomers around the world. The eruption, which is classified as a gamma-ray burst, or GRB, and designated GRB 130427A, produced the highest-energy light ever detected from such an event.

"We have waited a long time for a gamma-ray burst this shockingly, eye-wateringly bright," said Julie McEnery, project scientist for the Fermi Gamma-ray Space Telescope at NASA's Goddard Space Flight Center in Greenbelt, Md. "The GRB lasted so long that a record number of telescopes on the ground were able to catch it while space-based observations were still ongoing."


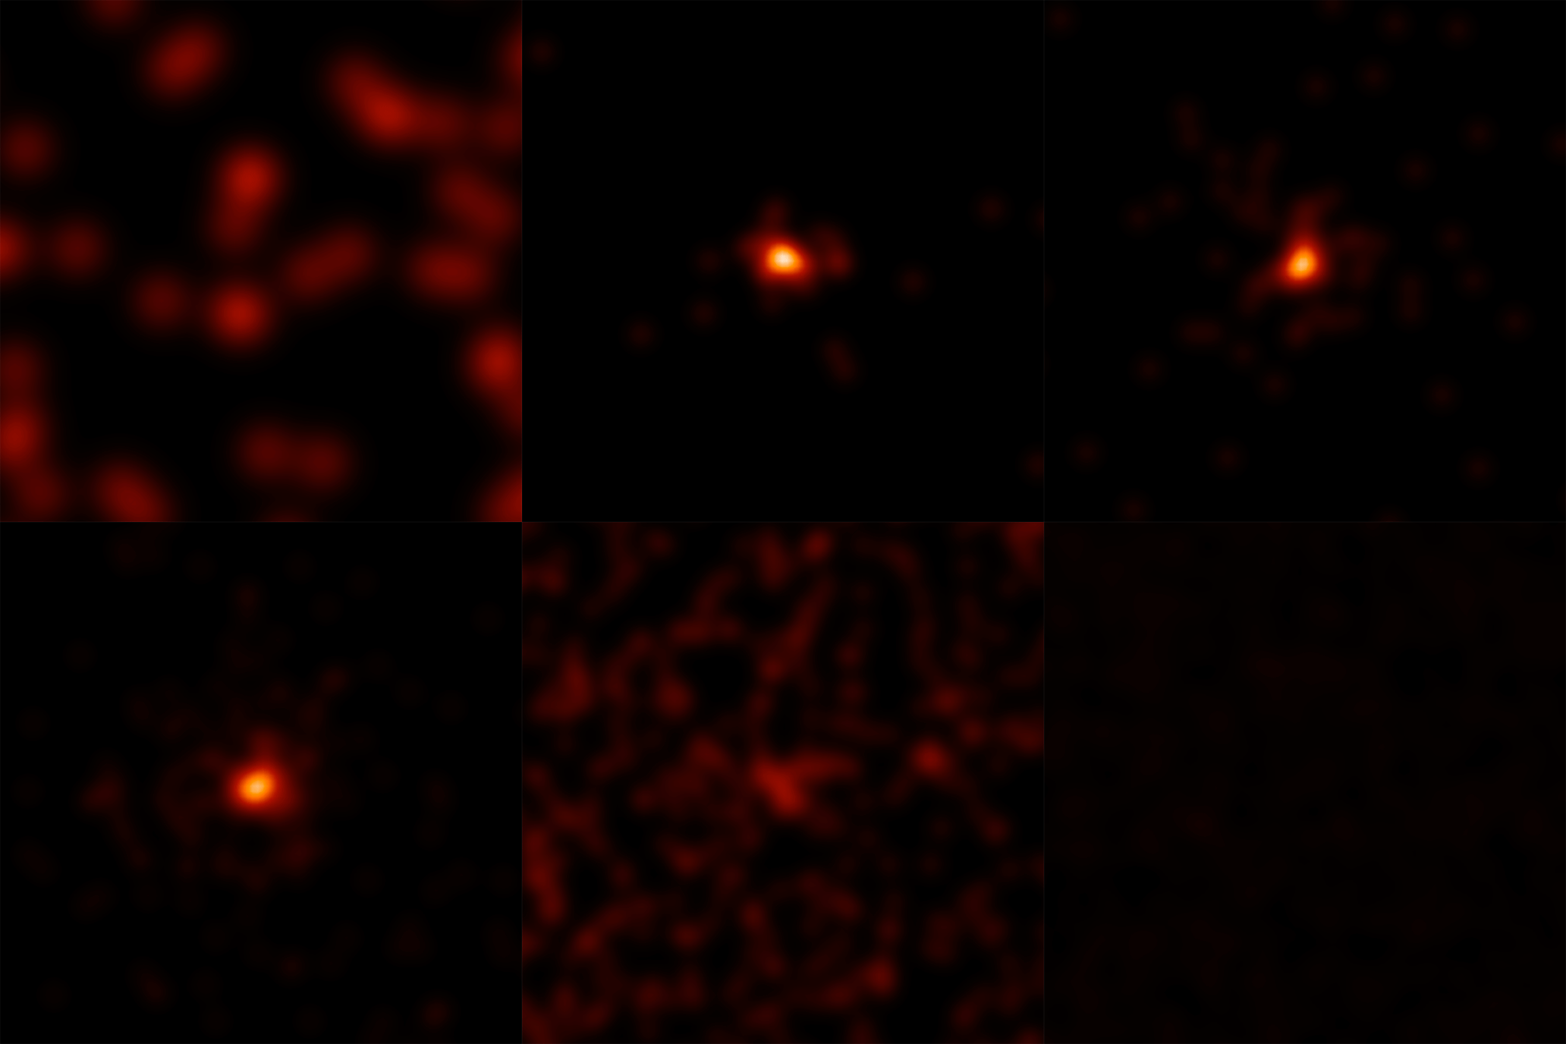
Animation above: The maps in this animation show how the sky looks at gamma-ray energies above 100 million electron volts (MeV) with a view centered on the north galactic pole. The first frame shows the sky during a three-hour interval prior to GRB 130427A. The second frame shows a three-hour interval starting 2.5 hours before the burst, and ending 30 minutes into the event. The Fermi team chose this interval to demonstrate how bright the burst was relative to the rest of the gamma-ray sky. This burst was bright enough that Fermi autonomously left its normal surveying mode to give the LAT instrument a better view, so the three-hour exposure following the burst does not cover the whole sky in the usual way. Credit: NASA/DOE/Fermi LAT Collaboration.

Just after 3:47 a.m. EDT on Saturday, April 27, Fermi's Gamma-ray Burst Monitor (GBM) triggered on an eruption of high-energy light in the constellation Leo. The burst occurred as NASA's Swift satellite was slewing between targets, which delayed its Burst Alert Telescope's detection by less than a minute.

Fermi's Large Area Telescope (LAT) recorded one gamma ray with an energy of at least 94 billion electron volts (GeV), or some 35 billion times the energy of visible light, and about three times greater than the LAT's previous record. The GeV emission from the burst lasted for hours, and it remained detectable by the LAT for the better part of a day, setting a new record for the longest gamma-ray emission from a GRB.


Animation above: This animation shows a more detailed Fermi LAT view of GRB 130427A. The sequence shows high-energy (100 Mev to 100 GeV) gamma rays from a 20-degree-wide region of the sky starting three minutes before the burst to 14 hours after. Following an initial one-second spike, the LAT emission remained relatively quiet for the next 15 seconds while Fermi's GBM instrument showed bright, variable lower-energy emission. Then the burst re-brightened in the LAT over the next few minutes and remained bright for nearly half a day. Credit: NASA/DOE/Fermi LAT Collaboration.

The burst subsequently was detected in optical, infrared and radio wavelengths by ground-based observatories, based on the rapid accurate position from Swift. Astronomers quickly learned that the GRB was located about 3.6 billion light-years away, which for these events is relatively close.

Gamma-ray bursts are the universe's most luminous explosions. Astronomers think most occur when massive stars run out of nuclear fuel and collapse under their own weight. As the core collapses into a black hole, jets of material shoot outward at nearly the speed of light.

The jets bore all the way through the collapsing star and continue into space, where they interact with gas previously shed by the star and generate bright afterglows that fade with time.


Image above: Swift's X-Ray Telescope took this 0.1-second exposure of GRB 130427A at 3:50 a.m. EDT on April 27, just moments after Swift and Fermi triggered on the outburst. The image is 6.5 arcminutes across. Credit: NASA/Swift/Stefan Immler.

If the GRB is near enough, astronomers usually discover a supernova at the site a week or so after the outburst.

"This GRB is in the closest 5 percent of bursts, so the big push now is to find an emerging supernova, which accompanies nearly all long GRBs at this distance," said Goddard's Neil Gehrels, principal investigator for Swift.

Ground-based observatories are monitoring the location of GRB 130427A and expect to find an underlying supernova by midmonth.

Related Links:

Download additional graphics from NASA Goddard's Scientific Visualization Studio: http://svs.gsfc.nasa.gov/vis/a010000/a011200/a011261/

Archive of GRB notices from the Gamma-ray Coordination Network: http://gcn.gsfc.nasa.gov/gcn3_archive.html

"NASA's Fermi Telescope Sees Most Extreme Gamma-ray Blast Yet"
(02.19.09): http://www.nasa.gov/mission_pages/GLAST/news/high_grb.html

NASA's Fermi Gamma-ray Space Telescope: http://www.nasa.gov/fermi

NASA's Swift mission: http://www.nasa.gov/swift

Animations (mentioned), Images (mentioned), Text, Credit: NASA's Goddard Space Flight Center / Francis Reddy.

Greetings, Orbiter.ch

Hubble Sees the Remains of a Star Gone Supernova


NASA - Hubble Space Telescope patch.

May 4, 2013


These delicate wisps of gas make up an object known as SNR B0519-69.0, or SNR 0519 for short. The thin, blood-red shells are actually the remnants from when an unstable progenitor star exploded violently as a supernova around 600 years ago. There are several types of supernovae, but for SNR 0519 the star that exploded is known to have been a white dwarf star — a Sun-like star in the final stages of its life.

SNR 0519 is located over 150 000 light-years from Earth in the southern constellation of Dorado (The Dolphinfish), a constellation that also contains most of our neighboring galaxy the Large Magellanic Cloud (LMC). Because of this, this region of the sky is full of intriguing and beautiful deep sky objects.

The LMC orbits the Milky Way galaxy as a satellite and is the fourth largest in our group of galaxies, the Local Group. SNR 0519 is not alone in the LMC; the NASA/ESA Hubble Space Telescope also came across a similar bauble a few years ago in SNR B0509-67.5, a supernova of the same type as SNR 0519 with a strikingly similar appearance.

For more information about Hubble visit: http://hubblesite.org/ and http://www.spacetelescope.org/

Image credits: ESA / Hubble & NASA. Acknowledgement: Claude Cornen / Text, Credits: European Space Agency  /NASA Hubble.

Best regards, Orbiter.ch

vendredi 3 mai 2013

Galileo and GPS ‘synchronise watches’: new time offset helps working together


ESA - GALILEO Mission logo.

3 May 2013

Ensuring the early interoperability of Europe’s satellite navigation with GPS, the four Galileo satellites have begun broadcasting the ‘offset’ between the parallel navigation systems’ timings, accurate to a few billionths of a second.

With satellite navigation based around the highly accurate measurement of signal travel times, both Galileo and GPS have their own internal reference time systems used to synchronise all system clocks and signals.

Galileo

The problem is these time systems are not quite identical, with Galileo System Time being around 50 nanoseconds or less apart from GPS time.

“A nanosecond is only a billionth of a second, corresponding to the time light takes to travel 30 cm,” explains Jörg Hahn, Galileo System Engineering Manager.

“But this soon adds up, and for anyone attempting to use the two systems together might find this ‘offset’ accounting for up to 15 m of error, causing an unacceptable contribution to user performance.”

Instead, this time offset needs to be known or estimated by the receiver itself.

Galileo to GPS Time Offset, GGTO

“The dissemination of the GPS to Galileo offset can help in constrained environments such as city centres, where only a few satellites are visible in the sky,” adds Jörg.

“The receiver can then take this offset and align all the observations to a single time scale, reducing the computational burden on the receiver since the amount of unknowns are decreased.”

Accordingly, disseminating the offset will help enable the user receiver market to start making use of Galileo at this early stage, with only four satellites yet in orbit.

Formally known as the GPS to Galileo time offset, GGTO, the accuracy of the offset is being benchmarked at five nanoseconds or less.

A tale of two times

Galileo runs on Galileo System Time, GST, which is generated on the ground at the Galileo Control Centre in Fucino, Italy, by the Precise Timing Facility, based on averages of different atomic clocks. GPS time is computed by the GPS control segment.

These two internal times are derived independently on one another but are kept close to the world’s reference time, UTC, with the offset between the two being precisely calculated on a continuous basis by the PTF and the resulting GGTO distributed through Galileo’s navigation message.

Fucino

GPS and Galileo share some frequencies (L1/E1 at 1575.420 MHz and L5/E5a at 1176.450 MHz) with a view to interoperability, and disseminating the GGTO makes using the two systems together more straightforward still.

“GGTO determination methods and interface design were agreed on a preliminary basis between the Galileo Project and the US Naval Observatory back in 2003, through a GGTO subgroup of the US and EU Working Group A on Compatibility and Interoperability,” Jörg concludes. “We’ve worked together closely since then to make the GGTO a reality.”

About satellite navigation: http://www.esa.int/Our_Activities/Navigation/About_satellite_navigation2

Europe's satellite navigation services: http://www.esa.int/Our_Activities/Navigation/Europe_s_satellite_navigation_services

Images, Text, Credits: ESA / P. Carril / Telespazio.

Cheers, Orbiter.ch

SolarImpulse ACROSS AMERICA 2013

SolarImpulse Across America 2013 patch.

May 3, 2013

Mission Kick-Off

Are you ready to be part of the adventure? Because the historic solar-powered crossing of the United States is about to begin!

SolarImpulse over San Francisco

Bertrand will pilot this first leg of the 2013 Across America mission while André will undertake the last one, Washington D.C. to New York City. With Bertrand at the commands, HB-SIA will take off from Moffett Airfield around 6 am PDT (UTC-7) on Friday May 3rd and land at Sky Harbor International Airport in Phoenix (AZ) sometime after midnight PDT (UTC-7).

The solar airplane will fly southbound, west of Yosemite National Park, above Fresno and Bakersfield. He will then veer westward toward Palmdale and Barstow, over the Mojave National Preserve in the direction of Phoenix.

The kick-off of the mission will also act as the launching of a global initiative - “Clean Generation” - to promote clean technologies. Pilots André and Bertrand will carry a USB key with them in the cockpit throughout the mission with all the names of Solar Impulse supporters. The goal is to encourage this global movement of change-makers to grow, raising awareness along the way about what can be done with innovative technologies for sustainable economic growth.

Across America 2013: Golden Gate Flight

Don't forget to watch the Solar Impulse TV that brings you all the most exciting news about mission flights LIVE directly on our homepage. Also, if you want to stay informed throughout the crossing and have your name virtually travel from California to New York, sign up today to become a Supporter!

As with all mission flights, pilots André and Bertrand will be tweeting from the ground and from the air: follow them directly on their Twitter accounts @ André and Bertrand or simply Solar Impulse.

Final itinerary revealed!

Solar Impulse’s 2013 Across America itinerary is now official!

    Moffett Airfield (Mountain View, CA)
    Sky Harbor International Airport (Phoenix, AZ)
    Dallas/Fort Worth International Airport (Dallas, TX)
    Lambert-St. Louis International Airport (St. Louis, MO)
    Dulles International Airport (Washington D.C.)
    John F. Kennedy International Airport (New York City)

Across America 2013 itinerary

We’ve all been touched by the incredible welcome the Federal Aviation Administration (FAA) and different airport authorities have given us in the United States. In fact, before we started organizing the mission, we were afraid we wouldn’t find airports ready to welcome our unique aircraft. To our surprise, it was exactly the opposite! This has obliged us to better evaluate our needs and decide accordingly.

The most difficult choice was our third stopover, which was torn between St. Louis (MO), Atlanta (GA) and Nashville (TN). For various reasons, including one very historical one, St. Louis was elected as the official third stopover. The Spirit of St. Louis, piloted by Charles Lindbergh, was the first aircraft to successfully undertake the crossing of the Atlantic, New York to Paris, in 1927. The 3,600 mile flight (5’800 km) started from Roosevelt Field on New York’s Long Island to Le Bourget Field in Paris. Although the aircraft was built in San Diego, it got its name in honor of the St. Louis Raquette Club - who financed the construction of the aircraft - and because it was Lindbergh’s residence at the time. 

It looks like the next possible date for the kick-off of the 2013 Across America mission could be this Friday, May 3rd! Weather conditions permitting, the flight would take off from Moffett Airfield to Sky Harbor International Airport in Phoenix (AZ). It will be an early departure, most likely before 6 am local time (UTC-7) with a landing after midnight local Phoenix time (UTC-7).

Join us in this incredible adventure! Sign-up today to ensure you get the latest news about the flights directly in your inbox!

And don’t forget, all Solar Impulse flights are broadcasted live on our website!: http://solarimpulse.com/

Images, Video, Text, Credit: SolarImpulse.

Greetings, Orbiter.ch

jeudi 2 mai 2013

Cluster Hears the Heartbeat of Magnetic Reconnection


ESA - Cluster II Mission patch.

02 May 2013

For the first time, scientists have resolved the detailed structure of the core region where magnetic reconnection takes place in the magnetosphere of Earth using unprecedented wave measurements. The study, based on data from ESA's Cluster mission, has mapped different types of electrostatic waves in this region. The waves trace populations of plasma particles that are involved in the different stages of a magnetic reconnection event.

In most cosmic environments, matter is not made up of neutral atoms and molecules, but rather of electrically charged particles and ions. This ionised state of matter, called plasma, is permeated by electric and magnetic fields caused by local inhomogeneities in the distribution of particles and ions. These fields in turn influence the dynamics of the plasma on larger scales, so the distribution of the particles, ions, and fields changes constantly.


Video above: Magnetic reconnection in Earth's magnetosphere. Credit: ESA/ATG medialab.

Magnetic reconnection is ubiquitous in the Universe. The phenomenon, which occurs in plasma, is triggered by microscopic processes and causes macroscopic effects: magnetic field lines from different domains collide and later assume a different configuration. Magnetic reconnection produces rapid and global changes to the arrangement of a magnetic environment – for example, the magnetosphere of Earth. This process is an efficient mechanism to convert energy stored in the magnetic field to kinetic energy.

Waves play an important role in the transfer of mass and energy across different plasma layers. Various types of waves develop during magnetic reconnection and tracing these waves through in situ measurements in Earth's magnetosphere is a unique way to investigate the reconnection process. Scientists have now used data from ESA's Cluster mission to characterise electrostatic waves in the tail of the magnetosphere and to 'see' into the heart of a magnetic reconnection region.

"Most of the action during a magnetic reconnection event takes place at the thin boundaries that separate different layers of plasma. For the first time, we were able to see through this thin boundary and identify the different types of waves that arise there," says Henrik Viberg from the Swedish Institute of Space Physics in Uppsala, Sweden. Viberg is a PhD student at Uppsala University and lead author of the paper, published in Geophysical Research Letters, reporting the new findings based on data from Cluster.

The magnetic reconnection region in the tail of Earth's magnetosphere. Credit: ESA/ATG medialab

Magnetic reconnection starts with two colliding flows of plasma whose magnetic fields are aligned along opposite directions: when pushed together, these create a thin sheet of current. As plasma keeps flowing towards this sheet from both sides, particles are accelerated and eventually released via two jets. This creates an X-shaped transition region, with a 'separatrix' region that divides the inflowing plasma from the outflows of highly energetic particles.

Viberg and his colleagues searched through the vast data archive of the Cluster mission for an event during which the spacecraft crossed the separatrix region during magnetic reconnection, and during which they were collecting data with the Wide Band Data (WBD) instrument. By making high-resolution measurements of the electric and magnetic fields, WBD allows scientists to probe the structure of the plasma through waves, rather than particles. Although they found only one suitable event in the archive, the spacecraft had crossed the transition between inflow and outflow regions several times during this event, providing enough statistics for a robust investigation.

"Since electrostatic waves are a local phenomenon and don't propagate over long distances, they allow us to look very closely into the magnetic reconnection region," explains Yuri Khotyaintsev, Viberg's supervisor at the Swedish Institute of Space Physics.

"The Cluster spacecraft detected waves only in the separatrix region – not in the inflowing or outflowing plasma – confirming our earlier suspicions. But there's more, because we have also resolved, for the first time, the structure of this region, as the spacecraft saw different types of electrostatic waves while flying across the separatrix."


Illustration above: Different types of waves in the magnetic reconnection region: Electron-Cyclotron waves are represented in cyan, Langmuir waves in blue and Electrostatic Solitary Waves in white. Credit: ESA/ATG medialab.

Close to the boundary between separatrix and inflow regions, the scientists identified two types of waves: one type with high frequencies, the Langmuir waves, and another with low frequencies, known as Electron-Cyclotron waves. Deeper into the separatrix region, towards the outflowing plasma, they detected Electrostatic Solitary Waves – single-pulsed waves that span a very broad frequency range.

"If we drew a parallel with sound waves, we could associate Langmuir waves with the high-pitched sound produced by a violin, while Electron-Cyclotron waves would be closer to the lower-pitched music from a cello," comments Khotyaintsev. "The Electrostatic Solitary Waves would be more like the sound of maracas, consisting of short, individual pulses based on more than one pitch."

This study provides the first detailed mapping of the types of waves found throughout the magnetic reconnection region and the first detection of Electron-Cyclotron waves in such a region. Resolving the structure of the separatrix region allows scientists to investigate the mechanisms underlying magnetic reconnection. Since different types of waves are produced by particles with different properties, the scientists analysed the correlation between the populations of particles detected in conjunction with the various types of waves.

ESA's Cluster II spacecrafts constellation. Image credit: ESA

"We find high-energy electrons along with Langmuir waves: this is consistent with what we believe to be the origin of these waves, which can be generated by beams of high-energy electrons emerging from the X-shaped reconnection region. We detected Electron-Cyclotron waves in the same region, but we were not able to identify the mechanism that generates them," says Viberg.

"Closer to the outflowing jets, the beam of high-energy electrons becomes more intense and flows of low-energy electrons streaming against the beam are also found here. This counter-streaming distribution is known to give rise to instabilities and, eventually, to Electrostatic Solitary Waves – which are exactly the waves we find in these regions," he adds.

In future studies, the scientists plan to investigate if and how these electrostatic waves, which are confined to the magnetic reconnection region, might produce electromagnetic waves, able to propagate over much longer distances. This would allow a comparison between Earth's magnetic environment and the many different sites where magnetic reconnection occurs, ranging from the corona of the Sun, to the accretion discs around forming stars, to plasma created in the laboratory.

"Working at the peak of its instrumental capabilities, Cluster has mapped what goes on at the core of the magnetic reconnection region. This provides an important insight into this fundamental process that takes place in plasma all across the Universe," concludes Matt Taylor, Cluster Project Scientist at ESA.

Notes for editors:

The study presented here is based on data gathered by three of the four Cluster spacecraft (C1, C3 and C4) on 10 September 2001 as they crossed a magnetic reconnection region in the magnetotail of Earth's magnetic environment.

Cluster is a constellation of four spacecraft flying in formation around Earth. It is the first space mission to be able to study, in three dimensions, the natural physical processes occurring within and near Earth's magnetosphere. Launched in 2000, it is composed of four identical spacecraft orbiting the Earth in a pyramidal configuration, along a nominal polar orbit of 4 × 19.6 Earth radii (1 Earth radius = 6380 km). Cluster's payload consists of state-of-the-art plasma instrumentation to measure electric and magnetic fields over a wide frequency range, and key physical parameters characterizing electrons and ions from energies of nearly 0 eV to a few MeV. The science operations are coordinated by the Joint Science Operations Centre (JSOC), at the Rutherford Appleton Laboratory, United Kingdom, and implemented by ESA's European Space Operations Centre (ESOC), in Darmstadt, Germany.

Related publications:

H. Viberg, et al., "Mapping High-Frequency Waves in the Reconnection Diffusion Region", 2013, Geophysical Research Letters, Vol. 40, Pages 1–6. DOI: 10.1002/grl.50227

For more information about Cluster mission, visit: http://sci.esa.int/science-e/www/area/index.cfm?fareaid=8

Images (mentioned), Animation (mentioned), Text, Credits: ESA.

Greetings, Orbiter.ch