jeudi 13 février 2014

NASA's IBEX Helps Paint Picture of the Magnetic System Beyond the Solar Wind


NASA - IBEX Mission patch.

February 13, 2014


Image above: A model of the interstellar magnetic fields – which would otherwise be straight -- warping around the outside of our heliosphere, based on data from NASA's Interstellar Boundary Explorer. The red arrow shows the direction in which the solar system moves through the galaxy. Image Credit: NASA/IBEX/UNH.

Understanding the region of interstellar space through which the solar system travels is no easy task. Interstellar space begins beyond the heliosphere, the bubble of charged particles surrounding the sun that reaches far beyond the outer planets. Voyager 1 has crossed into this space, but it’s difficult to gain a complete global picture from measurements in only one direction.

Spacecraft data in the past five years from near Earth and cosmic ray observations have painted a better picture of the magnetic system that surrounds us, while at the same time raising new questions. Scientists are challenging our current understanding in a new study that combines observations of massively energetic cosmic ray particles streaming in from elsewhere in the Milky Way along with observations from NASA's Interstellar Boundary Explorer, or IBEX.

The data sets show a magnetic field that is nearly perpendicular to the motion of our solar system through the galaxy. In addition to shedding light on our cosmic neighborhood, the results offer an explanation for a decades-old mystery on why we measure more incoming high-energy cosmic rays on one side of the sun than on the other. The research appears in the Feb. 13, 2014, issue of Science Express.

"It's a fascinating time," said Nathan Schwadron, of the University of New Hampshire in Durham and first author on the paper. "Fifty years ago, we were making the first measurements of the solar wind and understanding the nature of what was just beyond near-Earth space. Now, a whole new realm of science is opening up as we try to understand the physics all the way outside the heliosphere."

The heliosphere is formed as the constant stream of particles from the sun's solar wind flows outward in all directions until it slows down to balance the pressure from the interstellar wind. The only information gathered directly from the heart of this complex boundary region is from NASA's Voyager mission. Voyager 1 entered the boundary region in 2004, passing beyond the termination shock where the solar wind abruptly slows down. Voyager 1 crossed into interstellar space in 2012.

Artist's view of the IBEX spacecraft. Image Credit: NASA

IBEX, which orbits Earth, studies these regions from afar. The spacecraft detects energetic neutral atoms that form from interactions at the heliosphere's boundaries – an area that holds fascinating clues to what lies beyond. These interactions are dominated by electromagnetic forces. The incoming particles from the galaxy are made up of negatively-charged electrons, positively-charged atoms called ions, neutral particles and dust. Charged particles are forced to travel along the magnetic field lines that snake throughout space. Sometimes, a charged particle collides with a neutral atom at the outskirts of the heliosphere and captures an electron from the neutral atom. After stealing the electron, the charged particle becomes electrically neutral and speeds off in a straight line. Some of these fast neutral particles stream into the inner solar system and reach IBEX's detectors. Depending on the speed and direction of those neutral particles, scientists can determine information about the atoms and magnetic field lines involved in the original collision.

In 2009, IBEX scientists presented research showing an uneven distribution of neutral atoms. There was a ribbon along the heliospheric boundaries sending a preponderance of neutral atoms toward IBEX.

Researchers wondered if this shape might also relate to an unevenness seen in cosmic rays. On Earth, we measure more cosmic rays – particles that stream in from the rest of the galaxy at 99% the speed of light – coming in from near the tail side of the heliosphere than from the other side. Teasing out the source and paths of incoming cosmic rays isn't easy as the rays gyrate around magnetic field lines both inside and outside our heliosphere before colliding with other particles in Earth’s atmosphere, giving a shower of secondary particles that, in turn, are what we detect. To complicate things further, the heliosphere is moving through the galaxy.

"At some level, it's like trying to determine the wind direction when you're riding a bike very quickly and the wind isn't particularly strong," said Eric Christian, the IBEX project scientist at NASA's Goddard Space Flight Center in Greenbelt, Md., and a co-author on the paper. "There's some effect from the wind, but it's small and hard to measure."


Image above: The magnetic fields in interstellar space proposed by IBEX predict that cosmic rays would come in as shown on the right – blue represents fewer rays. This looks similar to what is actually observed, shown on the left, thus supporting IBEX's findings. Image Credit: NASA/IBEX/UNH.

To see if the IBEX data related to the cosmic ray observations, Schwadron used IBEX data to build a computer model of what the interplanetary magnetic field would look like around the heliosphere. Without the heliosphere, the field lines would be straight and parallel.

"But the heliosphere is kind of like an egg sitting in the middle of all these magnetic field lines," said Schwadron. "The field lines have to distort themselves around that."

With this model in hand, he simulated how the heliosphere would affect the cosmic rays. He assumed that the rays came in to the heliosphere evenly from everywhere in space, but allowed them to be warped based on the local magnetic geometry. The simulations showed a non-uniform distribution of cosmic ray particles that jibed well with the unevenness seen in observations.

“The analysis of this important paper strongly correlates with the theoretical view of the heliosphere from the numerical model developed by our team, which uses IBEX observations to derive the interstellar magnetic field direction,” said Nick Pogorelov, a space scientist at the University of Alabama in Huntsville, who works with IBEX data. “It shows that the heliopause that separates solar and interstellar plasmas is very long, maybe 2 trillion miles in the downwind direction, and therefore may affect the transport of high-energy cosmic rays toward the solar system.”

Unfortunately, this doesn't prove that the heliosphere and the interstellar magnetic field are exclusively responsible for the cosmic ray mystery. However, this research shows that the magnetic configuration of our neighborhood does offer a potential answer.

Moreover, the agreement between what's seen in the cosmic ray data and by IBEX provides outside confirmation of IBEX's results of what the magnetic fields outside our heliosphere look like. That's an interesting piece of the puzzle, when compared with Voyager 1's measurements, because the Voyager 1 data provide a different direction for the magnetic fields just outside our heliosphere.

This doesn't mean that one set of data is wrong and one is right, says Schwadron. Voyager 1 is taking measurements directly, gathering data at a specific time and place; IBEX gathers information averaged over great distances, so, there is room for discrepancy. Indeed, that discrepancy can be used as a clue. Understand why there's a difference between the two measurements and we gain additional information. More IBEX observations and more Voyager observations will keep coming in. As with all research, more data will help unravel the picture and soon we will learn even more about how we fit into the rest of the universe.

For more information about IBEX, visit: http://www.nasa.gov/ibex

Images (mentioned), Text, Credits: NASA's Goddard Space Flight Center / Karen C. Fox.

Cheers, Orbiter.ch

Satellite Video Shows Movement of Major U.S. Winter Storm


NASA / NOAA - GOES R Satellite Mission patch.

February 13, 2014

GOES Satellite Video of Feb. 12, 2014 Snowstorm

Video above: This animation of NOAA's GOES satellite data shows the progression of the major winter storm in the U.S. south from Feb. 10 at 1815 UTC/1:15 p.m. EST to Feb. 12 to 1845 UTC/1:45 p.m. EST. Video Credit: NASA/NOAA GOES Project, Dennis Chesters.

A new NASA video of NOAA's GOES satellite imagery shows three days of movement of the massive winter storm that stretches from the southern U.S. to the northeast.

Visible and infrared imagery from NOAA's GOES-East or GOES-13 satellite from Feb. 10 at 1815 UTC/1:15 p.m. EST to Feb. 12 to 1845 UTC/1:45 p.m. EST were compiled into a video made by NASA/NOAA's GOES Project at NASA's Goddard Space Flight Center in Greenbelt, Md.

In the video, viewers can see the development and movement of the clouds associated with the progression of the frontal system and related low pressure areas that make up the massive storm. The video also shows the snow covered ground over the Great Lakes region and Ohio Valley that stretches to northern New England. The clouds and fallen snow data from NOAA's GOES-East satellite were overlaid on a true-color image of land and ocean created by data from the Moderate Resolution Imaging Spectroradiometer or MODIS instrument that flies aboard NASA's Aqua and Terra satellites.

On February 12 at 10 a.m. EST, NOAA's National Weather Service or NWS continued to issue watches and warnings from Texas to New England. Specifically, NWS cited Winter Storm Warnings and Winter Weather Advisories were in effect from eastern Texas eastward across the interior section of southeastern U.S. states and across much of the eastern seaboard including the Appalachians. Winter storm watches are in effect for portions of northern New England as well as along the western slopes of northern and central Appalachians. For updates on local forecasts, watches and warnings, visit NOAA's  www.weather.gov webpage.


Image above: This visible image of the winter storm over the U.S. south and East Coast was taken by NOAA's GOES-13 satellite on Feb. 12 at 1855 UTC/1:55 p.m. EST. Snow covered ground can be seen over the Great Lakes region and Ohio Valley. Image Credit: NASA/NOAA GOES Project.

NOAA's Weather Prediction Center or WPC noted the storm is expected to bring "freezing rain spreading into the Carolinas, significant snow accumulations are expected in the interior Mid-Atlantic states tonight into Thursday and ice storm warnings and freezing rain advisories are in effect across much of central Georgia.

GOES satellites provide the kind of continuous monitoring necessary for intensive data analysis. Geostationary describes an orbit in which a satellite is always in the same position with respect to the rotating Earth. This allows GOES to hover continuously over one position on Earth's surface, appearing stationary. As a result, GOES provide a constant vigil for the atmospheric "triggers" for severe weather conditions such as tornadoes, flash floods, hail storms and hurricanes.

For updated information about the storm system, visit NOAA's WPC website:  http://www.hpc.ncep.noaa.gov/

For more information about GOES satellites, visit: http://www.goes.noaa.gov/ or http://goes.gsfc.nasa.gov/

Image (mentioned), Video (mentioned), Text, Credits: NASA's Goddard Space Flight Center / Rob Gutro.

Best regards, Orbiter.ch

NASA Moves Longest-Serving Mars Spacecraft for New Observations


NASA - 2001 Mars Odyssey patch.

February 13, 2014

The maneuver took place Tuesday. Odyssey team engineers at NASA's Jet Propulsion Laboratory (JPL) in Pasadena, Calif., and Lockheed Martin Space Systems of Denver, designed the gentle move to accelerate Odyssey's drift toward a morning-daylight orbit. The desired change will occur gradually until the intended orbit geometry is reached in November 2015 and another maneuver halts the drift.

The change will enable observation of changing ground temperatures after sunrise and after sunset in thousands of places on Mars. Those observations could yield insight about the composition of the ground and about temperature-driven processes, such as warm-season flows observed on some slopes, and geysers fed by spring thawing of carbon-dioxide ice near Mars' poles.

"We're teaching an old spacecraft new tricks," said Odyssey Project Scientist Jeffrey Plaut of JPL. "Odyssey will be in position to see Mars in a more different light from ever before."

Neither Odyssey, nor any other NASA Mars orbiter since the 1970s, has flown an orbital pattern with a view of the ground in morning daylight. Earlier NASA orbiters and the European Space Agency's Mars Express orbiter have provided some tantalizing views of morning mists on Mars, but have concentrated on afternoon observation times when views of the surface are less hazy.

Odyssey was launched in 2001 and began its science mission 12 years ago this month. It is the longest-working spacecraft ever sent to Mars.


Image above: NASA's Mars Odyssey spacecraft has tweaked its orbit to help scientists make the first systematic observations of how morning fogs, clouds and surface frost develop in different seasons on the Red Planet. Image Credit: NASA/JPL-Caltech.

Odyssey completed Tuesday's maneuver at 12:03 p.m. PST (3:03 p.m. EST). It used four thrusters, each providing about 5 pounds (22 newtons) of force for a 29-second burn.

"This veteran spacecraft performed exactly as planned," said Odyssey Project Manager David Lehman of JPL.

Odyssey flies in an orbit nearly over the poles and synchronized with the sun. For most of its first six years at Mars, the orbit was set at about 5 o'clock, local solar time. At every spot Odyssey flew over as it made its dozen daily passes from the north pole region to the south pole region, the local solar time was about 5 p.m. Beneath the south-to-north leg of the orbit, the time was about 5 a.m. That orbit provided an advantage for the orbiter's Gamma Ray Spectrometer to have its cooling equipment pointed away from the sun. The spectrometer checked for evidence of water near the Martian surface. It made important discoveries of how widely water ice -- detected as hydrogen-- and other elements are distributed on Mars.

Later, Odyssey worked for three years in a 4 o'clock orbit. That provided an advantage for mineral mapping by the orbiter's Thermal Emission Imaging System (THEMIS). Mid-afternoon warmth made minerals' infrared signatures easier to identify. This timing, however, added stress to Odyssey's power system. It put more of each orbit into the planet's shadow, where solar panels are unproductive. After providing radio-relay support for the 2012 landing of NASA's Curiosity Mars rover, a maneuver set Odyssey on a slow drift to later times of day to help preserve the spacecraft's aging battery.

THEMIS Principal Investigator Philip Christensen of Arizona State University in Tempe, proposed letting the time of the orbit shift past 6 o'clock and then making daylight observations on the south-to-north half of the orbit, at about 6:45 a.m., rather than the north-to-south half. The science team and NASA agreed, and the Odyssey project planned this week's maneuver to get to the desired orbit sooner.

"We don't know exactly what we're going to find when we get to an orbit where we see the morning just after sunrise," Christensen said. "We can look for seasonal differences. Are fogs more common in winter or spring? We will look systematically. We will observe clouds in visible light and check the temperature of the ground in infrared."

After the next orbit-adjustment maneuver, to lock into the 6:45 a.m. local time in November 2015, Odyssey will have about enough propellant left for nine to 10 years of operation at estimated annual consumption rates. In addition to conducting its own observations, Odyssey serves as an important communications relay for spacecraft on Mars' surface.

JPL manages Odyssey for NASA's Science Mission Directorate in Washington. Lockheed Martin Space Systems built the spacecraft and collaborates with JPL in mission operations.

For more about the Mars Odyssey mission, visit: http://mars.jpl.nasa.gov/odyssey

Image (mentioned), Text, Credits: NASA / Dwayne Brown / JPL / Guy Webster.

Greetings, Orbiter.ch

mercredi 12 février 2014

Largest Solar System Moon Detailed in Geologic Map


NASA - Voyager 1 & 2 Mission patch / NASA - Galileo Mission patch.

February 12, 2014

Rotating Globe of Ganymede Geology

Video above: Animation of a rotating globe of Jupiter's moon Ganymede, with a geologic map superimposed over a global color mosaic. The 37-second animation begins as a global color mosaic image of the moon then quickly fades in the geologic map. Image Credit: USGS Astrogeology Science Ctr/Wheaton/ASU/NASA/JPL-Caltech.

More than 400 years after its discovery by astronomer Galileo Galilei, the largest moon in the solar system – Jupiter's moon Ganymede – has finally claimed a spot on the map.

A group of scientists led by Geoffrey Collins of Wheaton College has produced the first global geologic map of Ganymede, Jupiter’s seventh moon. The map combines the best images obtained during flybys conducted by NASA's Voyager 1 and 2 spacecraft (1979) and Galileo orbiter (1995 to 2003) and is now published by the U. S. Geological Survey as a global map. It technically illustrates the varied geologic character of Ganymede’s surface and is the first global, geologic map of this icy, outer-planet moon.

“This map illustrates the incredible variety of geological features on Ganymede and helps to make order from the apparent chaos of its complex surface,” said Robert Pappalardo of NASA’s Jet Propulsion Laboratory in Pasadena, Calif. “This map is helping planetary scientists to decipher the evolution of this icy world and will aid in upcoming spacecraft observations.”

The European Space Agency's Jupiter Icy Moons Explorer mission is slated to be orbiting Ganymede around 2032. NASA is contributing a U.S.-led instrument and hardware for two European-led instruments for the mission.

Ganymede Global Geologic Map and Global Image Mosaic

Image above: To present the best information in a single view of Jupiter's moon Ganymede, a global image mosaic was assembled, incorporating the best available imagery from NASA's Voyager 1 and 2 spacecraft and NASA's Galileo spacecraft. Image Credit: USGS Astrogeology Science Center/Wheaton/NASA/JPL-Caltech.

Since its discovery in January 1610, Ganymede has been the focus of repeated observation, first by Earth-based telescopes, and later by the flyby missions and spacecraft orbiting Jupiter. These studies depict a complex, icy world whose surface is characterized by the striking contrast between its two major terrain types: the dark, very old, highly cratered regions, and the lighter, somewhat younger (but still very old) regions marked with an extensive array of grooves and ridges.

According to the scientists who have constructed this map, three major geologic periods have been identified for Ganymede that involve the dominance of impact cratering, then tectonic upheaval, followed by a decline in geologic activity. The map, which illustrates surface features, such as furrows, grooves and impact craters, allows scientists to decipher distinct geologic time periods for an object in the outer solar system for the first time.

Galileo spacecraft. Image Credit:NASA / JPL

“The highly detailed, colorful map confirmed a number of outstanding scientific hypotheses regarding Ganymede’s geologic history, and also disproved others,” said Baerbel Lucchitta, scientist emeritus at the U.S. Geological Survey in Flagstaff, Ariz., who has been involved with geologic mapping of Ganymede since 1980. “For example, the more detailed Galileo images showed that cryovolcanism, or the creation of volcanoes that erupt water and ice, is very rare on Ganymede.”

The Ganymede global geologic map will enable researchers to compare the geologic characters of other icy satellite moons, because almost any type of feature that is found on other icy satellites has a similar feature somewhere on Ganymede.

“The surface of Ganymede is more than half as large as all the land area on Earth, so there is a wide diversity of locations to choose from,” Collins said. “Ganymede also shows features that are ancient alongside much more recently formed features, adding historical diversity in addition to geographic diversity.”

Voyager 1 & 2 (identical spacecrafts). Image Credit:NASA / JPL

Amateur astronomers can observe Ganymede (with binoculars) in the evening sky this month, as Jupiter is in opposition and easily visible.

The project was funded by NASA through its Outer Planets Research and Planetary Geology and Geophysics Programs. NASA's Jet Propulsion Laboratory is managed by the California Institute of Technology, Pasadena.

Related Missions:

NASA Voyager: http://www.nasa.gov/mission_pages/voyager/

NASA Galileo Mission: http://science.nasa.gov/missions/galileo/

Image (mentioned), Video (mentioned), Text, Credits: NASA / JPL / Jia-Rui Cook.

Greetings, Orbiter.ch

Largest Flock of Earth-Imaging Satellites Launch into Orbit From Space Station


ISS - International Space Station patch.

February 12, 2014

It is often said that if everyone had the opportunity to see Earth from the perspective of astronauts in space, respect and admiration for our planet would grow and the environment would be better protected. A new fleet of 28 small satellites, called Flock 1, may help provide this perspective to people like never before. Considered the largest single constellation of Earth-imaging satellites ever to launch into space, the Flock 1 satellites began deploying today from the International Space Station.

Built and operated by Planet Labs of San Francisco, the Flock 1 small satellites are individually referred to as Doves. The Dove satellites are part of a class of miniature satellites often called CubeSats. These small satellites will capture imagery of Earth for use in humanitarian, environmental and commercial applications. Data collected by the Flock 1 constellation will be universally accessible to anyone who wishes to use it.


Image above: The 28 Dove satellites that make up Planet Labs’ Flock 1 mission, seen here before delivery to the International Space Station, will be the largest single constellation of Earth-imaging satellites ever to launch into space. Image Credit: Planet Labs.

“We believe that the democratization of information about a changing planet is the mission that we are focused on, and that, in and of itself, is going to be quite valuable for the planet,” says Robbie Schingler, co-founder of Planet Labs. “One tenet that we have is to make sure that we produce more value than we actually capture, so we have an open principle within the company with respect to anyone getting access to the data.”

The Dove CubeSats use an automated approach where the spacecraft take pictures over various areas, store them, and transmit them when positioned over a ground station. Planet Labs then processes the imagery and uploads it online for anyone to access it. The Flock 1 constellation of satellites may also be used in concert with high-resolution assets like unmanned aerial vehicles and large imaging satellites in order to follow-up on an identified area and gather more imagery in greater detail.

Imagery from Flock 1 enables identification of areas for disaster relief and improved agricultural yields in developing countries around the globe. Users also can apply this imagery resource to global environmental protection measures, such as monitoring deforestation and changes to polar ice caps.


Image above: A close-up of one of the 28 Dove satellites that is part of the Planet Labs’ Flock 1 mission. The Flock 1 constellation of satellites deployed today from the International Space Station. Image Credit: Planet Labs.

“Our company goal is to image everywhere very frequently, for everyone,” explains Schingler. “If you image everywhere, then that actually means that you can image anywhere. That’s going to be quite transformative for a number of countries, for a number of companies, and so forth. Our monitoring capability is always on. We are always taking a picture.”

Commercial applications of the imagery include mapping, real estate and construction, and oil and gas monitoring. If a company has high-value, distributed assets that need regular monitoring, Flock 1 imagery can assist in this type of endeavor. For example, Flock 1 can supplement or replace the need for flying a helicopter over an oil pipeline to monitor for a leak, since the 28 Dove CubeSats can quickly collect the necessary imagery.

The revisit rate, or frequency with which Dove CubeSats pass over a given area, is currently unprecedented among existing satellite systems in orbit. Imagery will be collected at latitudes within 52 degrees of the equator, which encompass expanses north and south of the equator that cover the majority of the world’s populated areas and agricultural regions. The Flock 1 constellation will travel in a lower orbit than most satellites, at a distance between 240 and 400 miles above Earth. For comparison, weather and commercial communications satellites are often given geostationary orbits, which are circular orbits above the Earth’s equator at a distance of approximately 22,236 miles above Earth.


Image above: This image of sea ice in the Gulf of Bothnia off the coast of Lulea, Sweden was taken on April 26, 2013 by the Planet Labs Dove 2 satellite, a predecessor of the Flock 1 Earth-imaging constellation of small satellites. Data collected by Flock 1 will be universally accessible. Image Credit: Planet Labs.

The Flock 1 constellation will deploy from the space station using the NanoRacks Smallsat Deployment Program to launch from the station’s Japanese Experiment Module (JEM) airlock. The NanoRacks deployer provides commercial access to space, via the space station, for CubeSats to perform Earth and deep space observation. View the illustrated simulation by NanoRacks to see how these small satellites are deployed into space.

Previous launches of similar CubeSat hardware by Planet Labs served as an extension of their laboratory and optimized the software and hardware to prepare the Dove CubeSats for success. Software for all satellites in the Flock 1 constellation can be reprogrammed very quickly while in orbit.

“Our ability to build and operate spacecraft will allow us to do more with these spacecraft in the future as we begin to think about the satellite segment as a very remote server with a whole bunch of sensors on board that could be reprogrammed to do other things,” says Schingler.

Set of NanoRacks CubeSats Deployed From International Space Station

Image above: The Small Satellite Orbital Deployer (SSOD), in the grasp of the Kibo laboratory robotic arm, is photographed by an Expedition 38 crew member on the International Space Station as it deploys a set of NanoRacks CubeSats. The CubeSats program contains a variety of experiments such as Earth observations and advanced electronics testing. Station solar array panels, Earth’s horizon and the blackness of space provide the backdrop for the scene. Image Credit: NASA.

With the existing infrastructure provided by the space station and the various spacecraft that service it, companies like Planet Labs are gaining consistent access to space. Commercial opportunities for CubeSats and other research on and off the space station exist through a public-private partnership enabled by congress in which the station serves as a National Laboratory. The National Laboratory, managed by the Center for Advancement of Science in Space (CASIS), provides funding avenues for programs like the NanoRacks Smallsat Deployment Program to open up research and exploration in space for many more users.

“The deployment of 28 satellites all at once is going to be the largest deployment of a single constellation of satellites that works together at one time and the largest Earth-observation constellation of satellites ever,” says Schingler. “This is possible because we are able to get to space via the space station.”

CubeSats like the Doves in the Flock 1 constellation are just the tip of the iceberg. As new CubeSats deploy, more data is gathered, systems are optimized and, eventually, new types of spacecraft are developed based on their predecessors in space. The space station allows for the expansion of commercial ventures in low-Earth orbit. The Earth-imaging mission of Planet Labs’ Flock 1 takes another leap toward creating benefits on Earth resulting from innovation in space.

Related links:

Planet Labs: http://planet-labs.com/

Flock 1: http://www.planet-labs.com/#missions

NanoRacks Smallsat Deployment Program: http://nanoracks.com/products/smallsat-deployment/

Center for Advancement of Science in Space (CASIS): http://www.iss-casis.org/

Japanese Experiment Module (JEM): http://www.nasa.gov/mission_pages/station/structure/elements/jem.html#.UqjBzPRDs1I

International Space Station: http://www.nasa.gov/mission_pages/station/main/index.html

Images (mentioned), Text, Credits: NASA’s Johnson Space Center / Laura Niles.

Best regards, Orbiter.ch

A good year to find a comet


Asteroid & Comet Watch.

12 February 2014

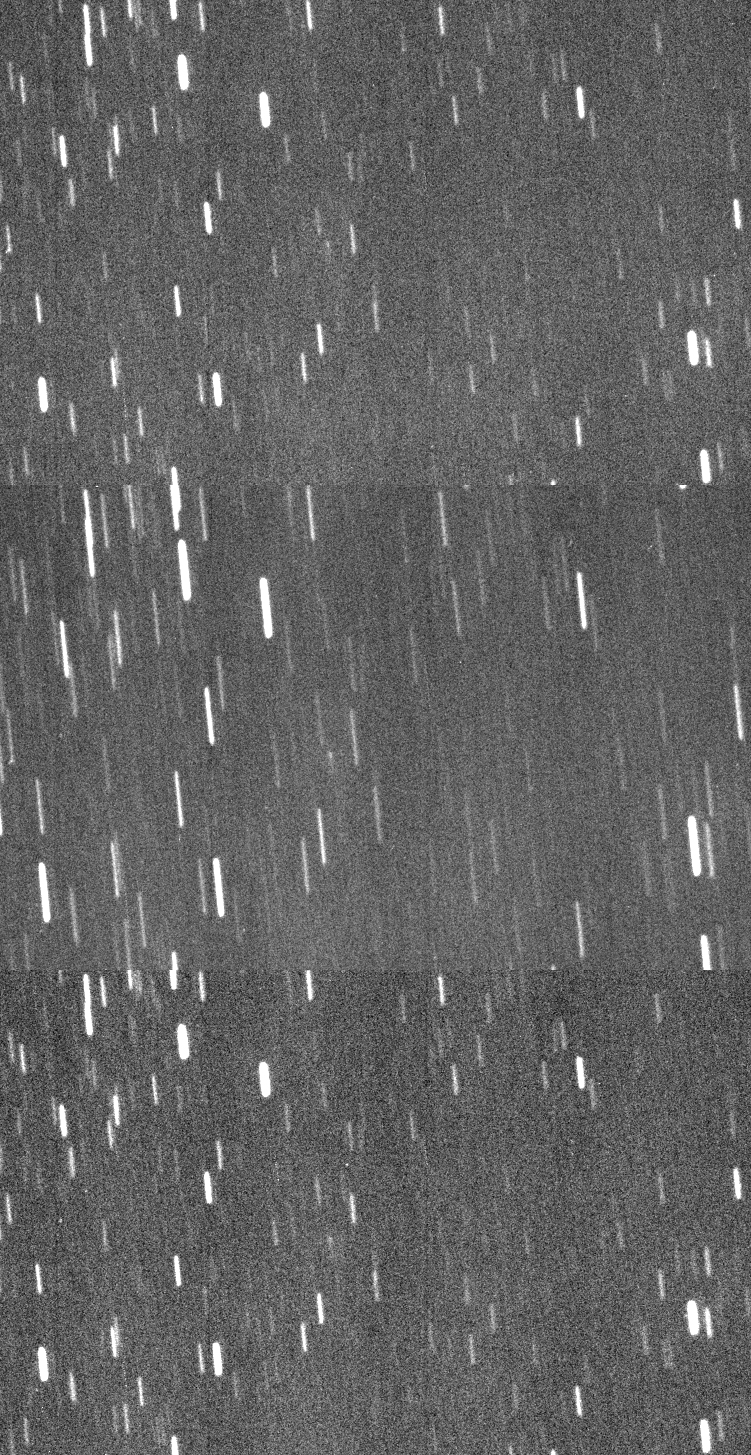
A team of European astronomers has found a previously unknown comet, detected as a tiny blob of light orbiting our Sun deep in the Solar System.

Europe’s Teide Observatory Tenerife Asteroid Survey team has been credited with discovering comet P/2014 C1, named ‘TOTAS’ in recognition of the teamwork involved in the find.

Comet P/2014 C1 seen from Argentina

The comet was unexpectedly discovered on 1 February during a routine set of observations using the 1 m-diameter telescope at ESA’s Optical Ground Station, Tenerife, Spain.

The confirmation was announced by the International Astronomical Union’s Minor Planet Center, the international clearing house for all such discoveries, on 4 February, after eight other observatories confirmed the sighting.

The tiny object is extremely faint, and its orbit was determined to lie between Jupiter and Mars – it will not come close to Earth.

Comet year

“All comets are interesting especially as they are thought to have played a role in bringing water to Earth in the distant past,” says Detlef Koschny, responsible for near-Earth object (NEO) activities at ESA’s Space Situational Awareness (SSA) programme office.

“Later this year, Rosetta will meet up with another comet, 67P/Churyumov–Gerasimenko, and study its nucleus and surrounding gas and dust, so it’s especially fitting that a European team has found a new comet this year.”

Orbit of comet P/2014 C1 TOTAS

This latest discovery was, in fact, made by software, which compares successive images to find ‘movers’ – objects that move against the star field background. The find was confirmed by Rafal Reszelewski, working as part of the team to verify possible new objects automatically flagged by the software.

Since 2010, the TOTAS team has been working in collaboration with ESA’s SSA office to conduct periodic sky surveys to find and confirm asteroids and other NEOs that orbit close to Earth. In 2011, it found asteroid 2011 SF108, which does orbit much closer to Earth.

Related links:

TOTAS sky survey: http://vmo.estec.esa.int/totas

About SSA: http://www.esa.int/Our_Activities/Operations/Space_Situational_Awareness/About_SSA

SSA Programme overview: http://www.esa.int/Our_Activities/Operations/Space_Situational_Awareness/SSA_Programme_overview

Near-Earth Objects - NEO Segment: http://www.esa.int/Our_Activities/Operations/Space_Situational_Awareness/Near-Earth_Objects_-_NEO_Segment

More information:

MPC - Minor Planet Center: http://minorplanetcenter.net/

About SSA-NEO Coordination Centre: http://www.esa.int/Our_Activities/Operations/Space_Situational_Awareness/About_SSA-NEO_Coordination_Centre

Images, Text, Credits: ESA / FRAM / GLORIA / Martin Masek / TOTAS.

Greetings, Orbiter.ch

mardi 11 février 2014

NASA's Curiosity Drives On After Crossing Martian Dune


NASA - Mars Science Laboratory (MSL) patch.

February 11, 2014

Movie of Curiosity's View Backwards While Crossing Dune

Animated image above: The series of nine images making up this animation were taken by the rear Hazard-Avoidance Camera (rear Hazcam) on NASA's Curiosity Mars rover as the rover drove over a dune spanning "Dingo Gap" on Mars. Image Credit: NASA/JPL-Caltech.

NASA's Curiosity Mars rover is continuing its traverse toward enticing science destinations after climbing over a dune spanning a gap in a ridge.

The rover covered 135 feet (41.1 meters) on Feb. 9, in its first drive since the 23-foot (7-meter) crossing of the dune on Feb. 6. That put Curiosity's total odometry since its August 2012 landing at 3.09 miles (4.97 kilometers).

Curiosity Making Headway West of 'Dingo Gap'

Image above: NASA's Curiosity Mars rover used the Navigation Camera (Navcam) on its mast to catch this look-back eastward at wheel tracks from driving through and past "Dingo Gap" inside Gale Crater. Image Credit: NASA/JPL-Caltech.

An animated sequence of images from the low-slung Hazard-Avoidance Camera on the rear of the vehicle documents the up-then-down crossing of the dune.

NASA's Mars Science Laboratory Project is using Curiosity to assess ancient habitable environments and major changes in Martian environmental conditions. JPL, a division of the California Institute of Technology in Pasadena, built the rover and manages the project for NASA's Science Mission Directorate in Washington.

For more information about Curiosity, visit http://www.nasa.gov/msl and http://mars.jpl.nasa.gov/msl/. You can follow the mission on Facebook at http://www.facebook.com/marscuriosity and on Twitter at: http://www.twitter.com/marscuriosity.

Images (mentioned), Text, Credits: NASA / JPL / Guy Webster.

Best regards, Orbiter.ch