vendredi 3 juin 2016

Hubble Rocks with a Heavy-Metal Home


NASA - Hubble Space Telescope patch.

June 3, 2016


This 10.5-billion-year-old globular cluster, NGC 6496, is home to heavy-metal stars of a celestial kind! The stars comprising this spectacular spherical cluster are enriched with much higher proportions of metals — elements heavier than hydrogen and helium are curiously known as metals in astronomy — than stars found in similar clusters.

A handful of these high-metallicity stars are also variable stars, meaning that their brightness fluctuates over time. NGC 6496 hosts a selection of long-period variables — giant pulsating stars whose brightness can take up to, and even over, a thousand days to change — and short-period eclipsing binaries, which dim when eclipsed by a stellar companion.

The nature of the variability of these stars can reveal important information about their mass, radius, luminosity, temperature, composition, and evolution, providing astronomers with measurements that would be difficult or even impossible to obtain through other methods.

NGC 6496 was discovered in 1826 by Scottish astronomer James Dunlop. The cluster resides at about 35,000 light-years away in the southern constellation of Scorpius (The Scorpion).

For images and more information about the Hubble Constant finding and Hubble, visit:

http://hubblesite.org/
http://www.nasa.gov/hubble
https://www.spacetelescope.org/

Image Credits: ESA/Hubble & NASA, Acknowledgement: Judy Schmidt/Text Credits: European Space Agency/NASA/Ashley Morrow.

Greetings, Orbiter.ch

jeudi 2 juin 2016

GPM Looks at Rainfall in Texas and Oklahoma Flooding


NASA & JAXA - Global Precipitation Measurement (GPM) logo.

June 2, 2016

NASA and JAXA Satellite Looks at Rainfall in Texas and Oklahoma Flooding

NASA's Integrated Multi-satellitE Retrievals for GPM (IMERG) calculated rainfall that occurred over a week and caused major flooding in Texas and Oklahoma, as well as soaking rains in South Carolina from Tropical Depression Bonnie.

IMERG uses data from NASA and the Japan Aerospace Agency's Global Precipitation Measurement mission (GPM) satellite and other satellites.


Image above: MERG estimated rainfall totals from May 27 to June 2, 2016. Rainfall totals can be seen off the coast of the Carolinas from Tropical Depression Bonnie. Totals in parts of southeastern Texas were estimated by IMERG to be over 431 mm (17 inches). Image Credits: NASA/JAXA/SSAI, Hal Pierce.

Continuing heavy rain has resulted in dangerous flooding conditions from Oklahoma through eastern Texas. The Brazos, Trinity and Colorado Rivers in Southeastern Texas are at or above flood stage. Flooding resulted in the deaths of at least 6 people in Texas during the past week. Governor Greg Abbott declared a state of disaster in 31 Texas counties. Over 20 inches of rainfall were reported in some areas since May 30, 2016.

Parts of Georgia and the Carolinas were also flooded by a very slow moving tropical depression Bonnie.

This estimate of rainfall totals from May 27, 2016 to June 2, 2016 was made using data from NASA's Integrated Multi-satellitE Retrievals for GPM (IMERG). During this period rainfall totals in parts of southeastern Texas were estimated by IMERG to be over 431 mm (17 inches).

NASA's IMERG Adds Up a Week of Soaking Rainfall in Texas

Video above: An estimate of rainfall totals from May 27, 2016 to June 2, 2016 was made using data from NASA's Integrated Multi-satellitE Retrievals for GPM (IMERG). During this period rainfall totals in parts of southeastern Texas were estimated by IMERG to be over 431 mm (17 inches). Video Credits: NASA/JAXA/SSAI, Hal Pierce.

Global precipitation estimates are provided by IMERG through the use of data from satellites in the GPM Constellation and is calibrated with measurements from the GPM Core Observatory as well as rain gauge networks around the world.


Image above: Global Precipitation Measurement (GPM) Core satellite. Image Credits: NASA/JAXA.

NOAA's National Weather Prediction Center in College Park, Maryland said today in the forecast discussion: A slow-moving frontal boundary will continue to move across the southern plains and lower Mississippi valley today, with scattered to numerous showers and thunderstorms expected today and tonight. Heavy rainfall amounts of 1 to 3 inches are possible across portions of the southern plains and western Gulf Coast, and flash flooding is possible. On Friday the front will become stationary across Texas, keeping numerous showers and thunderstorms in place from the eastern half of Texas to eastward to the lower Mississippi valley through Saturday morning.

While along the U.S. Southeast, Tropical Depression Bonnie is expected to start moving away from North Carolina's Outer Banks later in the day on June 2 and June 3.

Related links:

Global Precipitation Measurement (GPM): http://www.nasa.gov/mission_pages/GPM/main/index.html and http://global.jaxa.jp/projects/sat/gpm/

Goddard Space Flight Center: https://www.nasa.gov/centers/goddard/home/index.html

Images (mentioned), Video (mentioned), Text, Credits: SSAI/NASA's Goddard Space Flight Center/Hal Pierce/Lynn Jenner.

Greetings, Orbiter.ch

Fireball Lights Pre-Dawn Sky over Arizona


Asteroid Watch logo.

June 2, 2016


Image above: Image obtained from the NASA meteor camera situated at the MMT Observatory on the site of the Fred Lawrence Whipple Observatory, located on Mount Hopkins, Arizona, in the Santa Rita Mountains. Image Credits: NASA/MEO.

For a few seconds early Thursday, night turned into day as an extremely bright fireball lit the pre-dawn sky over much of Arizona, blinding all-sky meteor cameras as far away as western New Mexico.

Based on numerous eyewitness accounts, a small asteroid estimated at 10 feet (3 meters) in diameter – with a mass in the tens of tons and a kinetic energy of approximately 10 kilotons – entered Earth’s atmosphere above Arizona just before 4 a.m. local (MST) time. NASA estimates that the asteroid was moving at about 40,200 miles per hour (64,700 kilometers per hour).

NASA Meteor Cam Video of June 2, 2016 Arizona Fireball

Video above: Video obtained from the NASA meteor camera situated at the MMT Observatory on the site of the Fred Lawrence Whipple Observatory, located on Mount Hopkins, Arizona, in the Santa Rita Mountains. Video Credits: NASA/MEO.

Eyewitness reports placed the object at an altitude of 57 miles above the Tonto National Forest east of the town of Payson, moving almost due south. It was last seen at an altitude of 22 miles above that same forest.

“There are no reports of any damage or injuries—just a lot of light and few sonic booms,” said Bill Cooke in NASA's Meteoroid Environment Office at the Marshall Space Flight Center in Huntsville, Alabama. “If Doppler radar is any indication, there are almost certainly meteorites scattered on the ground north of Tucson.”

Sedona Red Rock Cam footage of fireball on June 2, 2016

Video above: This footage from the Sedona Red Rock Cam (part of the EarthCam network) shows how brightly the ground was illuminated during the fireball, which entered the atmosphere over Arizona shortly before 4 a.m. MST on June 2, 2016. Video Credits: Sedona Red Rock Cam/EarthCam.

The NASA Meteoroid Environments Office (MEO) monitors the small rock (meteoroid) environment near Earth in order to assess the risks posed to spacecraft by these bits of tiny space debris. As part of this effort, it operates a network of meteor cameras within the U.S. that are capable of detecting meteors brighter than the planet Jupiter. Three of these cameras are in southern Arizona.

Cooke notes that he and other meteor experts are having difficulty obtaining data on the June 2 fireball from meteor camera videos, since many of the cameras were almost completely saturated by the bright event.

The event did leave smoke trails that were caught on video: https://www.youtube.com/watch?v=GN--uCY0LUY and https://www.youtube.com/watch?v=4sOqPOL1gIM.

Animation of Orbit and Approach of June 2, 2016 Arizona Fireball

Video above: This animation shows the orbit of the June 2, 2016 Arizona fireball and the view from its perspective as it approaches Earth. Video Credits: NASA/MEO.

Meteoroid impacts are a continuously occurring natural process.  Every day, about 80 to 100 tons of material falls upon the Earth from space in the form of dust and meteorites. Over the past 20 years, U.S. government sensors have detected nearly 600 small asteroids, a few meters in size, which have entered the Earth’s atmosphere and created spectacular bolides. The superbolide that impacted over Chelyabinsk, Russia in 2013 is estimated to have been 65 feet (20 meters) in size and released over 40 times the energy of the Arizona fireball. Impacts of that size take place a few times a century, and impacts of larger asteroids are expected to be far less frequent (on the scale of centuries to millennia) but can happen on any day.

NASA’s Planetary Defense Coordination Office is responsible for finding, tracking, and characterizing near-Earth asteroids, identifying potentially hazardous objects, and planning for the mitigation of potential impacts to Earth that could do damage at ground level. More than 14,000 near-Earth asteroids (NEAs) have been discovered since NASA-sponsored efforts began in 1998 to detect, track and catalogue asteroids and comets.

Related links:

NASA's Meteoroid Environment Office: https://www.nasa.gov/offices/meo/home/index.html

NASA’s Planetary Defense Coordination Office: http://www.nasa.gov/planetarydefense

Meteors & Meteorites: http://www.nasa.gov/topics/solarsystem/features/watchtheskies/index.html

Image (mentioned), Videos (mentioned), Text, Credits: NASA/Bill Keeter.

Greetings, Orbiter.ch

Secrets Revealed from Pluto’s ‘Twilight Zone’


NASA - New Horizons Mission logo.

June 2, 2016

 Image Credits: NASA/JHUAPL/SwRI

NASA’s New Horizons spacecraft took this stunning image of Pluto only a few minutes after closest approach on July 14, 2015. The image was obtained at a high phase angle –that is, with the sun on the other side of Pluto, as viewed by New Horizons. Seen here, sunlight filters through and illuminates Pluto’s complex atmospheric haze layers. The southern portions of the nitrogen ice plains informally named Sputnik Planum, as well as mountains of the informally named Norgay Montes, can also be seen across Pluto’s crescent at the top of the image.

Looking back at Pluto with images like this gives New Horizons scientists information about Pluto’s hazes and surface properties that they can’t get from images taken on approach. The image was obtained by New Horizons’ Ralph/Multispectral Visual Imaging Camera (MVIC) approximately 13,400 miles (21,550 kilometers) from Pluto, about 19 minutes after New Horizons’ closest approach. The image has a resolution of 1,400 feet (430 meters) per pixel.  Pluto’s diameter is 1,475 miles (2,374 kilometers).

The inset at top right shows a detail of Pluto’s crescent, including an intriguing bright wisp (near the center) measuring tens of miles across that may be a discreet, low-lying  cloud in Pluto’s atmosphere; if so, it would be the only one yet identified in New Horizons imagery. This cloud – if that’s what it is – is visible for the same reason the haze layers are so bright: illumination from the sunlight grazing Pluto’s surface at a low angle. Atmospheric models suggest that methane clouds can occasionally form in Pluto’s atmosphere. The scene in this inset is 140 miles (230 kilometers) across.


Image above: A full-resolution, unannotated view of Pluto’s ‘Twilight Zone’. Image Credits: NASA/JHUAPL/SwRI.

The inset at bottom right shows more detail on the night side of Pluto. This terrain can be seen because it is illuminated from behind by hazes that silhouette the limb. The topography here appears quite rugged, and broad valleys and sharp peaks with relief totaling 3 miles (5 kilometers) are apparent.  This image, made from closer range, is much better than the lower-resolution images of this same terrain taken several days before closest approach.  These silhouetted terrains therefore act as a useful “anchor point,” giving New Horizons scientists a rare, detailed glimpse at the lay of the land in this mysterious part of Pluto seen at high resolution only in twilight. The scene in this inset is 460 miles (750 kilometers) wide.

For more information about New Horizons, visit: http://www.nasa.gov/mission_pages/newhorizons/main/index.html

Images (mentioned), Text, Credits: NASA/Bill Keeter.

Greetings, Orbiter.ch

Fifty Years of Moon Dust: Surveyor 1 was a Pathfinder for Apollo


NASA - Lunar Surveyor patch.

June 2, 2016

Before humans could take their first steps on the moon, that mysterious and forbidding surface had to be reconnoitered by robots. When President John Kennedy set a goal of landing astronauts on the lunar surface in 1961, little was known of that world, beyond what could be gleaned from observations by telescopes.

We knew it was rocky, bleak and heavily cratered -- how might these conditions affect the landing of a spacecraft there? Was the surface sufficiently solid to support the 33,500-pound Apollo lunar lander? Or was it so deeply covered in dust from billions of years of meteorite impacts, as some theorized, that the lunar module would simply sink out of sight, dooming the astronauts? These and a hundred other questions about the surface composition dogged mission planners, so a robot would make the dangerous journey first – the lunar lander from NASA's Jet Propulsion Laboratory.

America’s First Lunar Surveyor: 50 Years Later

The first probes to reach Earth’s nearest neighbor were Russian. Luna 2 impacted the surface in 1959, and the moon was photographed from orbit by another Soviet robot later that year. The U.S. flew a series of impactor probes called Ranger; the first success of that program was Ranger 7, which returned 4,300 images of increasing resolution during the final 17 minutes of flight in 1964. The USSR scored another coup when it made the first soft landing and took the first low-resolution photos of the moon's surface, in February 1966. A series of U.S. mapping spacecraft called Lunar Orbiter photographed the moon from orbit in 1966 and 1967. But it would be the Surveyors that would scout that rugged surface for Apollo, and 50 years ago this week, the first of that series of landers touched down successfully. Surveyor 1 landed on the moon on June 2, 1966.

The leap from impactors and airbag landings to a controlled landing was a big one, and required new, never-before-attempted techniques in guidance, navigation, robotics and imaging. Surveyor was the first spacecraft of its kind, a go-for-broke program that was racing to return data even as the Apollo program was in high gear. The first crewed Apollo landings were expected sometime in 1968 or 1969, so time was short.

Justin Rennilson, formerly of JPL, was the co-principal investigator on the Surveyor television experiment. “Planning for Apollo required getting really high-resolution images showing the details of the lunar surface, because they were talking about designing a spacecraft that would safely land on the lunar surface as we would with Surveyor,” he said. “Telescopic photographs of the moon were taken from Earth, but what we needed were high-resolution images to study the rocks on the lunar surface. Even something two feet in size could topple a spacecraft.”

The Surveyor program was already in the pipeline before President Kennedy announced his goals for lunar exploration. Surveryor had been intended as a scientific investigation of the moon. But its mission was revised immediately after the young president’s address to a joint session of Congress: “I believe this nation should commit itself to achieving the goal, before this decade is out, of landing a man on the moon and returning him safely to Earth.” With those words, NASA would steer the bulk of Surveyor’s mission toward supporting that goal.


Image above: Image of Surveyor 1's shadow against the lunar surface in the late lunar afternoon, with the horizon at the upper right.Surveyor 1, the first of the Surveyor missions to make a successful soft landing, proved the spacecraft design and landing technique. In addition to transmitting over 11,000 pictures, it sent information on the bearing strength of the lunar soil, the radar reflectivity, and temperature. Image Credits: NASA/JPL.

The first Surveyors were tasked with reaching the lunar surface successfully via a soft landing, then investigating the physical properties of the nearby landscape to understand the risks and challenges to landing astronauts there. But that first successful landing was far from assured. NASA had accomplished flybys of Venus and Mars, but had not attempted landing on any celestial body before Surveyor. Among hundreds of other challenges, an uninterrupted communication link for navigation and control would be critical to success.

“We figured the probability of success at around 10 to 15 percent,” Rennilson said. “We had a lot of problems, not only on the spacecraft but also at JPL. The lab, which managed the Surveyor program for NASA, had just recently finished a new space flight operations facility, the SFOF. This had a telemetry connection with Goldstone, a tracking station in the California desert (now part of NASA's Deep Space Network) that would be accommodating the communication needs of the spacecraft during landing. But there were signal dropouts. They didn’t know what to do, so they sent me to Goldstone.” He arrived at the tracking station just prior to the landing on June 2.

Surveyor had been sent on a direct trajectory -- it would not enter lunar orbit before landing, but would hurtle directly towards the surface at 6,000 mph (9,700 kilometers per hour). The thrusters had to fire at precisely the right moment and maintain perfect orientation to communicate with Earth, all the way down.

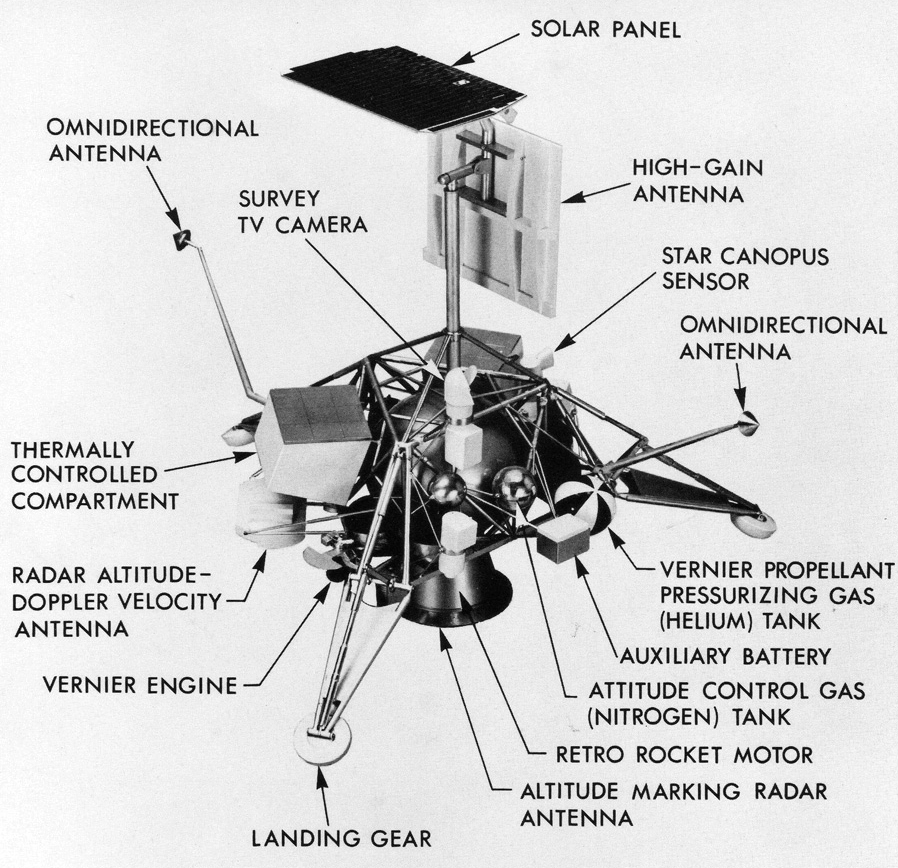
Surveyor lunar lander description. Image Credit: NASA

“I remember sitting there watching the oscilloscope as the spacecraft was coming down, all the way to the lunar surface. ‘God, the signal is still there and it is still working!’ I thought. We were successful and it was just astounding.” Immediately upon Surveyor’s arrival on the moon, Rennilson hopped another plane to return to JPL.

After the failure of a number of the Ranger spacecraft en route to the moon, the success of the first Surveyor landing was an incredible relief. William Pickering, the director of JPL from 1954 through 1976, recalled in a 1978 Caltech interview that he had some concerns about the television networks’ request to carry the landing live on what he thought was to be national coverage: “We finally ended up by agreeing to let them do it, and we kept our fingers crossed and hoped it was going to be all right. But the thing that startled me was that about a half an hour before it was due to land, one of the network people said, ‘Oh, by the way, we’re live all over the world,’ which really sort of shook me. Fortunately, it worked, and in fact, sometime later a friend of mine told me that he was in Paris, and he just idly turned on the television set and there was Surveyor 1 landing on the moon.”

With Surveyor 1 down and safe, the exploration of the moon would now begin in earnest. The landing site was a few dozen miles north of a 13-mile-wide (21-kilometer) crater called Flamsteed that resided within Oceanus Procellarum, the largest of the moon’s smooth basaltic mare, or plains. The first views of the lunar surface were striking, but not easily acquired. Photography from space was still in its infancy.

The camera was advanced for its time, a slow-scan television imager with a zoom lens -- the first time such an arrangement had been used in space. The goal of the researchers was to gather enough imagery to identify and investigate specific surface features, and also to create panoramic photos that would allow them to get a sense of the overall nature of the surface and any threats it might pose to the Apollo lunar lander.

Surveyor 1 landing site seen by Lunar Reconnaissance Orbiter (LRO). Image Credits: NASA/LRO

The first sets of panoramic images were created using a then-new technique of taking instant-photography images from a small TV screen and then assembling the photographs into a larger image. Rennilson remembers the process vividly: “We had a Polaroid camera attached to a 5-inch-diameter CRT so that you could capture images on Polaroid film. These images were given to a crew that we had trained -- who would put them down in a particular order -- to create the panoramas.” That crew trained long and hard to prepare for the process. “We got so that after years of practicing, we were able to put down a panorama about three to four minutes after completing all that panning of the lunar surface.”

By the end of Surveyor 1’s mission six months after it landed on the moon, 11,240 images had been returned, allowing for the creation of dozens of wide panoramas and allowing the examination of details as small as 0.04 inches (1 millimeter) in diameter. Images of the three footpads demonstrated that not only was landing on the moon possible, but that the lander had not sunk into deep moon dust -- as was feared by some scientists -- but had landed on a firm, supportive surface. Beginning with Surveyor 3, a scoop attached to an extendable arm allowed scientists to investigate the texture and hardness of the lunar surface. By the time Surveyor 7 completed operations on the moon in February 1968 -- just 10 months before Apollo 8 orbited the moon -- the pathway to the first crewed lunar landing of Apollo 11 on July 20, 1969, was open. The Surveyor program had been critical to that accomplishment.

Rennilson concludes: “The Chinese have an interesting saying: ‘When you take a drink of water, you should think of the source.’ I think that applies to the early unmanned space program. JPL has engineered so much of the modern stuff we do in space today. My remembrances are primarily about all the great things that we saw. So when Apollo landed, and when Curiosity landed on Mars, it was a great feeling.”

Related links:

Surveyor: https://www.nasa.gov/subject/3442/surveyor

Apollo: https://www.nasa.gov/mission_pages/apollo/index.html

NASA History: https://www.nasa.gov/topics/history/index.html

Images (mentioned), Video, Text, Credits: NASA/Tony Greicius/JPL/DC Agle, written by Rod Pyle.

Best regards, Orbiter.ch

Hubble Finds Universe Is Expanding Faster Than Expected


ESA - Hubble Space Telescope logo.

June 2, 2016

Astronomers using NASA’s Hubble Space Telescope have discovered that the universe is expanding 5 percent to 9 percent faster than expected.

“This surprising finding may be an important clue to understanding those mysterious parts of the universe that make up 95 percent of everything and don’t emit light, such as dark energy, dark matter and dark radiation,” said study leader and Nobel Laureate Adam Riess of the Space Telescope Science Institute and Johns Hopkins University, both in Baltimore, Maryland.


Image above: This Hubble Space Telescope image shows one of the galaxies in the survey to refine the measurement for how fast the universe expands with time, called the Hubble constant. Image Credits: NASA, ESA and A. Riess (STScI/JHU).

The results will appear in an upcoming issue of The Astrophysical Journal.

Riess’ team made the discovery by refining the universe’s current expansion rate to unprecedented accuracy, reducing the uncertainty to only 2.4 percent. The team made the refinements by developing innovative techniques that improved the precision of distance measurements to faraway galaxies.

The team looked for galaxies containing both Cepheid stars and Type Ia supernovae. Cepheid stars pulsate at rates that correspond to their true brightness, which can be compared with their apparent brightness as seen from Earth to accurately determine their distance. Type Ia supernovae, another commonly used cosmic yardstick, are exploding stars that flare with the same brightness and are brilliant enough to be seen from relatively longer distances.


Image above: This illustration shows the three steps astronomers used to measure the universe's expansion rate to an unprecedented accuracy, reducing the total uncertainty to 2.4 percent. Image Credits: NASA, ESA, A. Feild (STScI), and A. Riess (STScI/JHU).

By measuring about 2,400 Cepheid stars in 19 galaxies and comparing the observed brightness of both types of stars, they accurately measured their true brightness and calculated distances to roughly 300 Type Ia supernovae in far-flung galaxies.

The team compared those distances with the expansion of space as measured by the stretching of light from receding galaxies. They used these two values to calculate how fast the universe expands with time, or the Hubble constant.

The improved Hubble constant value 45.5 miles per second per megaparsec. (A megaparsec equals 3.26 million light-years.) The new value means the distance between cosmic objects will double in another 9.8 billion years.

Cepheids in UGC 9391

Image above: This image taken with the NASA/ESA Hubble Space Telescope shows one of the galaxies in the survey to refine the measurement for how fast the Universe expands with time, called the Hubble constant. Image Credit: NASA, ESA, and A. Riess (STScI/JHU).

This refined calibration presents a puzzle, however, because it does not quite match the expansion rate predicted for the universe from its trajectory seen shortly after the Big Bang. Measurements of the afterglow from the Big Bang by NASA’s Wilkinson Microwave Anisotropy Probe (WMAP) and the European Space Agency’s Planck satellite mission yield predictions which are 5 percent and 9 percent smaller for the Hubble constant, respectively.

“If we know the initial amounts of stuff in the universe, such as dark energy and dark matter, and we have the physics correct, then you can go from a measurement at the time shortly after the big bang and use that understanding to predict how fast the universe should be expanding today,” said Riess. “However, if this discrepancy holds up, it appears we may not have the right understanding, and it changes how big the Hubble constant should be today.”

Comparing the universe’s expansion rate with WMAP, Planck, and Hubble is like building a bridge, Riess explained. On the distant shore are the cosmic microwave background observations of the early universe. On the nearby shore are the measurements made by Riess’ team using Hubble.

“You start at two ends, and you expect to meet in the middle if all of your drawings are right and your measurements are right,” Riess said. “But now the ends are not quite meeting in the middle and we want to know why.”

There are a few possible explanations for the universe’s excessive speed. One possibility is that dark energy, already known to be accelerating the universe, may be shoving galaxies away from each other with even greater — or growing — strength.

Animation of cosmic distance ladder

Video above: This animation shows the principle of the cosmic distance ladder used by Adam Riess and his team to reduce the uncertainty of the Hubble constant. Video Credit:
NASA, ESA, A. Feild (STScI), and A. Riess (STScI/JHU).

Another idea is that the cosmos contained a new subatomic particle in its early history that traveled close to the speed of light. Such speedy particles are collectively referred to as “dark radiation” and include previously known particles like neutrinos. More energy from additional dark radiation could be throwing off the best efforts to predict today's expansion rate from its post-Big Bang trajectory.

The boost in acceleration could also mean that dark matter possesses some weird, unexpected characteristics. Dark matter is the backbone of the universe upon which galaxies built themselves up into the large-scale structures seen today.

And finally, the speedier universe may be telling astronomers that Einstein’s theory of gravity is incomplete.

“We know so little about the dark parts of the universe, it’s important to measure how they push and pull on space over cosmic history,” said Lucas Macri of Texas A&M University in College Station, a key collaborator on the study.

The Hubble observations were made with Hubble’s sharp-eyed Wide Field Camera 3 (WFC3), and were conducted by the Supernova H0 for the Equation of State (SH0ES) team, which works to refine the accuracy of the Hubble constant to a precision that allows for a better understanding of the universe’s behavior.

Hubble and the sunrise over Earth. Video Credit: ESA

The SH0ES team is still using Hubble to reduce the uncertainty in the Hubble constant even more, with a goal to reach an accuracy of 1 percent. Current telescopes such as the European Space Agency’s Gaia satellite, and future telescopes such as the James Webb Space Telescope (JWST), an infrared observatory, and the Wide Field Infrared Survey Telescope (WFIRST), also could help astronomers make better measurements of the expansion rate.

Before Hubble was launched in 1990, the estimates of the Hubble constant varied by a factor of two. In the late 1990s the Hubble Space Telescope Key Project on the Extragalactic Distance Scale refined the value of the Hubble constant to within an error of only 10 percent, accomplishing one of the telescope’s key goals. The SH0ES team has reduced the uncertainty in the Hubble constant value by 76 percent since beginning its quest in 2005.

The Hubble Space Telescope is a project of international cooperation between NASA and the European Space Agency. NASA’s Goddard Space Flight Center in Greenbelt, Maryland, manages the telescope. The Space Telescope Science Institute (STScI) in Baltimore, Maryland, conducts Hubble science operations. STScI is operated for NASA by the Association of Universities for Research in Astronomy in Washington, D.C.

Related links:

Wilkinson Microwave Anisotropy Probe (WMAP): http://map.gsfc.nasa.gov/

Planck satellite mission: https://www.nasa.gov/mission_pages/planck/overview.html and http://www.esa.int/Our_Activities/Space_Science/Planck

Supernova H0 for the Equation of State (SH0ES) team: http://www.stsci.edu/~ariess/Research.htm

James Webb Space Telescope (JWST): http://www.nasa.gov/jwst

Wide Field Infrared Survey Telescope (WFIRST): http://www.nasa.gov/wfirst

For images and more information about the Hubble Constant finding and Hubble, visit:

http://hubblesite.org/
http://www.nasa.gov/hubble
https://www.spacetelescope.org/

Images (mentioned), Videos (mentioned), Text, Credits: NASA/Ashley Morrow/Space Telescope Science Institute/Donna Weaver/Ray Villard/Space Telescope Science Institute and The Johns Hopkins University/Adam Riess/European Space Agency (ESA).

Best regards, Orbiter.ch

Rosetta safe mode 5 km from comet


ESA - Rosetta Mission patch.

June 2, 2016

Over the weekend, Rosetta experienced a ‘safe mode’ event 5 km from the surface of Comet 67P/Churyumov-Gerasimenko. Contact with the spacecraft has since been recovered and the mission teams are working to resume normal operations.

“We lost contact with the spacecraft on Saturday evening for nearly 24 hours,” says Patrick Martin, ESA’s Rosetta mission manager. “Preliminary analysis by our flight dynamics team suggests that the star trackers locked on to a false star – that is, they were confused by comet dust close to the comet, as has been experienced before in the mission.”

Image Credits: ESA/C.Carreau.

This led to spacecraft pointing errors, which triggered the safe mode. Unfortunately the star trackers then got hung in a particular sub mode requiring specific action from Earth to recover the spacecraft.

“It was an extremely dramatic weekend,” says Sylvain Lodiot, ESA’s Rosetta spacecraft operations manager.

“After we lost contact, we sent commands ‘in the blind’, which successfully tackled the hung star tracker issue and brought the spacecraft back into three-axis stabilised safe mode, and we now have contact with the spacecraft again. However, we are still trying to confirm the spacecraft’s exact position along its orbit around the comet – we only received images for navigation this morning, the first since Saturday.”

As is normal during an event like this, extra ground tracking station time was requested to provide additional support for recovering the spacecraft. The regularly scheduled Rosetta tracking slot using ESA's New Norcia deep space station in Australia on Sunday was extended, with time reallocated from Mars Express operations. The blind commanding was done from New Norcia, and later, ESA's Cebreros deep space station in Spain was also used to support the recovery.

Star tracker recap

The spacecraft’s star trackers are used to navigate, and help control the attitude of the spacecraft. By using an autonomous star pattern recognition function, they provide input to the onboard Attitude and Orbit Control and Measurement Subsystem used to maintain the spacecraft’s orientation with respect to the stars. This allows the spacecraft to know its orientation with respect to the Sun and Earth. In turn, this ensures the spacecraft can correctly orient its high gain antenna, used to send and receive signals to and from ground stations on Earth.


Image above: Rosetta's star trackers are marked here in red (above Philae in this pre-seperation artist impression). Part of the high gain antenna can be seen in the background. Image Credits: ESA/ATG medialab.

Correct attitude is maintained when the star trackers are properly tracking stars. If this is interrupted, the spacecraft’s antenna can drift away from Earth and communication with the spacecraft potentially lost. When the star trackers are not tracking, the attitude is propagated on gyro measurements. But the attitude can drift, especially if the spacecraft is slewing a lot.

Operating close to the comet means that the spacecraft is surrounded by a lot of dust. Even though the comet’s activity has diminished significantly since passing through its closest point to the Sun along its orbit last August, the environment is still dusty enough that the star trackers can occasionally mistake comet debris in its field of view for stars.

What happens next?

As usual with a safe mode, the science instruments are automatically switched off, allowing the spacecraft operators to take the necessary steps to fully recover the spacecraft before resuming science operations. Prior to the safe mode, the plan for this week was to move into 30 km orbits around the comet on Wednesday 1 June. The team still hopes to meet this target and be able to resume normal operations by then.

Update 2 June: The transition to the 30 km orbit started as planned, yesterday morning, with an orbital correction manoeuvre to bring Rosetta to 30 km by late Friday night (the orbit insertion manoeuvre is planned for 01:40 UTC Saturday). The spacecraft's instruments are also now back in science operations mode.


Image above: OSIRIS narrow-angle camera image taken in the morning of 28 May 2016 (many hours before the safe mode) when Rosetta was 7.05 km from the centre of Comet 67P/Churyumov–Gerasimenko. The scale is 0.13 m/pixel. Image Credits: ESA/Rosetta/MPS for OSIRIS Team MPS/UPD/LAM/IAA/SSO/INTA/UPM/DASP/IDA.

The challenges ahead

The dramatic events of the weekend are a stark reminder of the dangers associated with flying close to the comet, and highlights the risks the spacecraft will face during the final few weeks of the mission as it descends even closer to the comet.

“The last six weeks of the mission will be far more challenging for flight dynamics than deploying Philae to the surface was in November 2014, and it is always possible that we could get another safe mode when flying close to the comet like this,” says Sylvain.

“Although we will take more risks nearer to the end of the mission, we’ll always put the spacecraft safety first.

“However,  the very final sequence where Rosetta makes a controlled impact on the surface of the comet should not be affected by such star tracker issues as we plan to take them out of the attitude and orbit control system loop.”

The team will also consider taking the star trackers out of the loop when required in the last weeks of the mission.

Details of Rosetta’s final descent will be provided soon. The provisional plan is to target the small lobe close to Philae’s original planned landing site at Agilkia, most likely on 30 September.

Related links:

Comet viewer tool: http://sci.esa.int/comet-viewer/

Where is Rosetta?: http://sci.esa.int/where_is_rosetta/

For more information about Rosetta mission, visit: http://www.esa.int/Our_Activities/Space_Science/Rosetta

Rosetta overview: http://www.esa.int/Our_Activities/Space_Science/Rosetta_overview

Rosetta in depth: http://sci.esa.int/rosetta

Images (mentioned), Text, Credit: European Space Agency (ESA).

Best regards, Orbiter.ch