mercredi 14 décembre 2016

Weekly Recap From the Expedition Lead Scientist, week of Dec. 5, 2016


ISS - Expedition 50 Mission patch.

Dec. 14, 2016

(Highlights: Week of Dec. 5, 2016) - Investigations this week on the International Space Station centered on technology demonstrations of wearable health monitors designed for long-duration space travel that might also be used on Earth.

NASA astronaut Shane Kimbrough calibrated and charged the Personal CO2 Monitors in preparation for distributing them to crew members to test their viability as wearable safety devices. Humans produce carbon dioxide through the natural breathing process, but too much CO2 in the air can cause headaches, dizziness, increased blood pressure and more severe symptoms. All human spacecraft must be designed with environmental control systems that remove this gas from the air supply, but the space environment can still lead to pockets of CO2 that are difficult to detect and remove. Much like the canary in a coalmine, the Personal CO2 Monitor demonstrates a new capability of wearable technology to continuously monitor astronauts' immediate surroundings on the space station.


Image above: ESA astronaut Thomas Pesquet captured this image while flying over South America on the International Space Station. He shared it to his Twitter social media account, calling it “a dragon-shaped river.” Image Credits: NASA/@Thom_astro.

Many industries on Earth require workers to enter enclosed spaces – such as mines, submarines, or construction tunnels and pipes -- where environmental monitoring is critical to safety. This technology could prove useful in these industries. With the addition of an alarm system, the Personal CO2 Monitor could serve as a warning device for hazardous conditions. The focus of the technology is to create a small, durable device that can be comfortably attached to clothing, making it well suited for continuous wear.

ESA (European Space Agency) astronaut Thomas Pesquet configured a biometric patch to wear on his arm and a Smartshirt to wear during an exercise period as part of the EVERYWEAR investigation. These items are data collection points that are downloaded onto a computer tablet for scientific and medical study. The ESA study will test this emerging technology for nutritional assessment, sleep quality evaluation and constant blood pressure measurement through the day’s activities. Part of the investigation is a new, easy-to-use application on an iPad, simplifying the procedure for astronauts and saving valuable time to perform other tasks in orbit. The data is automatically recorded to the iPad and downloaded to scientists for the project in Toulouse, France.


Image above: NASA astronaut Shane Kimbrough works on the Capillary Flow Experiment – 2, which demonstrates how capillary forces work in space. Image Credit: NASA.

NASA astronaut Peggy Whitson installed a camera system to record science operations for the Packed Bed Reactor Experiment (PBRE), an investigation that may help build better space vehicles. The experiment studies the behavior of gases and liquids as they simultaneously flow through the same column filled with fixed porous media. This is important for the study of many chemical and biological processing systems, as well as numerous geophysical applications.

Water-recovery systems, fuel cells and other equipment on the station use packed bed reactors, but none are designed to handle both liquid and gas at the same time. Scientists are working to understand how a packed bed two-phase flow would work in microgravity. The results of the experiment could help scientists design more efficient and lightweight thermal management and life support systems that use less energy, benefiting not only the space station, but future Mars missions as well.

Whitson joined Pesquet for their flight day 15 human research activities, which included collecting blood pressure and ultrasound measurements for the Biochemical Profile (Biochem Profile) and Cardio Ox investigations. The astronauts spend time in orbit studying themselves to learn how the human body reacts to long-duration spaceflight. Biochem Profile tests bodily fluid samples obtained from astronauts before, during and after spaceflight. Cardio Ox looks for signs of oxidative and inflammatory stress on cardiovascular health during and after spaceflight.


Image above: ESA astronaut Thomas Pesquet uses a tonometer to record how his arteries react to weightlessness. The tonometer is connected to an iPad that is running the EveryWear app, which offers one interface for a variety of health-related tasks. Image Credit: NASA.

Specific proteins and chemicals in the samples are used as biomarkers, or indicators of health. Post-flight analysis yields a database of samples and test results, which scientists can use to study the effects of spaceflight on the body. Establishing a chemical profile of the body’s response to spaceflight will help scientists understand how different systems in the body interact in microgravity in different groups of people. Scientists can also test the effectiveness of possible countermeasures like exercise and nutrition and their effects on crew health during long-duration exploration missions.

An improved understanding of the biochemical effects of microgravity could help patients with limited mobility on Earth, such as those on bed rest. Understanding how various physiological systems respond and interact to changing gravity conditions could help physicians design different treatments or exercises for people with limited mobility.

Crew members conducted other human research investigations this week, including At Home in Space, Repository, Habitability, ESA-Active-Dosimeters, Fine Motor Skills, Fluid Shifts, Vascular Echo, Dose Tracker and Space Headaches.

Progress also was made on other investigations and facilities this week, including Veg-03, Meteor, AstroPi, ISS Ham, Story Time From Space, ACE-T-1, CFE-2, EML Batch 1.2c, Group Combustion, JAXA ELF, Aerosol Samplers, ISS External Leak Locator, J-SSOD, Radi-N2, and CIR.

Related links:

Personal CO2 Monitors: http://www.nasa.gov/mission_pages/station/research/experiments/2101.html

EVERYWEAR investigation: https://www.nasa.gov/mission_pages/station/research/experiments/2308.html

Packed Bed Reactor Experiment (PBRE): https://www.nasa.gov/mission_pages/station/research/experiments/1111.html

Biochem Profile: http://www.nasa.gov/mission_pages/station/research/experiments/1008.html

At Home in Space: https://www.nasa.gov/mission_pages/station/research/experiments/1988.html

Repository: https://www.nasa.gov/mission_pages/station/research/experiments/981.html

Habitability: https://www.nasa.gov/mission_pages/station/research/experiments/1772.html

ESA-Active-Dosimeters: https://www.nasa.gov/mission_pages/station/research/experiments/2132.html

Fine Motor Skills: https://www.nasa.gov/mission_pages/station/research/experiments/1767.html

Fluid Shifts: https://www.nasa.gov/mission_pages/station/research/experiments/1257.html

Vascular Echo: https://www.nasa.gov/mission_pages/station/research/experiments/1921.html

Dose Tracker: http://www.nasa.gov/mission_pages/station/research/experiments/1933.html

Space Headaches: http://www.nasa.gov/mission_pages/station/research/experiments/181.html

Veg-03: https://www.nasa.gov/mission_pages/station/research/experiments/1294.html

Meteor: https://www.nasa.gov/mission_pages/station/research/experiments/1323.html

ISS Ham: http://www.nasa.gov/mission_pages/station/research/experiments/346.html

Story Time From Space: http://www.nasa.gov/mission_pages/station/research/experiments/1287.html

ACE-T-1: https://www.nasa.gov/mission_pages/station/research/experiments/2033.html

CFE-2: https://www.nasa.gov/mission_pages/station/research/experiments/459.html

Group Combustion: https://www.nasa.gov/mission_pages/station/research/experiments/1077.html

JAXA ELF: https://www.nasa.gov/mission_pages/station/research/experiments/1999.html

Aerosol Samplers: https://www.nasa.gov/mission_pages/station/research/experiments/2300.html

ISS External Leak Locator: https://www.nasa.gov/mission_pages/station/research/experiments/1817.html

Radi-N2: https://www.nasa.gov/mission_pages/station/research/experiments/898.html

CIR: https://spaceflightsystems.grc.nasa.gov/sopo/ihho/psrp/fcf/cir/

Space Station Research and Technology: https://www.nasa.gov/mission_pages/station/research/index.html

International Space Station (ISS): https://www.nasa.gov/mission_pages/station/main/index.html

Images (mentioned), Text, Credits: NASA/John Love, Acting Lead Increment Scientist Expeditions 49 & 50/Kristine Rainey.

Best regards, Orbiter.ch

Juno Captures Jupiter 'Pearl'


NASA - JUNO Mission logo.

Dec. 14, 2016

Image Credits: NASA/JPL-Caltech/SwRI/MSSS

This image, taken by the JunoCam imager on NASA's Juno spacecraft, highlights the seventh of eight features forming a ‘string of pearls’ on Jupiter -- massive counterclockwise rotating storms that appear as white ovals in the gas giant's southern hemisphere. Since 1986, these white ovals have varied in number from six to nine. There are currently eight white ovals visible.

The image was taken on Dec. 11, 2016, at 9:27 a.m. PST (12:27 EST), as the Juno spacecraft performed its third close flyby of Jupiter. At the time the image was taken, the spacecraft was about 15,300 miles (24,600 kilometers) from the planet.

JunoCam is a color, visible-light camera designed to capture remarkable pictures of Jupiter's poles and cloud tops. As Juno's eyes, it will provide a wide view, helping to provide context for the spacecraft's other instruments. JunoCam was included on the spacecraft specifically for purposes of public engagement; although its images will be helpful to the science team, it is not considered one of the mission's science instruments.

NASA's Jet Propulsion Laboratory, Pasadena, California, manages the Juno mission for the principal investigator, Scott Bolton, of Southwest Research Institute in San Antonio. The Juno mission is part of the New Frontiers Program managed by NASA's Marshall Space Flight Center in Huntsville, Alabama, for the Science Mission Directorate. Lockheed Martin Space Systems, Denver, built the spacecraft. JPL is a division of Caltech in Pasadena, California.

For more information about JUNO Mission: http://www.nasa.gov/mission_pages/juno/main/index.html

Image (mentioned), Text, Credits: NASA/Tony Greicius/JPL/DC Agle.

Greetings, Orbiter.ch

mardi 13 décembre 2016

NASA’s Exo-Brake 'Parachute' to Enable Safe Return for Small Spacecraft


NASA logo.

Dec. 13, 2016

International Space Station through the deployment of Exo-Brake. Image Credit: NASA

NASA’s “Exo-Brake” will demonstrate a critical technology leading to the potential return of science payloads to Earth from the International Space Station through the deployment of small spacecraft in early 2017.

An Exo-Brake is a tension-based, flexible braking device resembling a cross-parachute that deploys from the rear of a satellite to increase the drag. It is a de-orbit device that replaces the more complicated rocket-based systems that would normally be employed during the de-orbit phase of re-entry.

“The Exo-Brake’s current design uses a hybrid system of mechanical struts and flexible cord with a control system that ‘warps’ the Exo-Brake – much like how the Wright brothers used warping to control the flight behavior of their first wing design,” said Marcus Murbach, principal investigator and inventor of the Exobrake device.

This warping, combined with real-time simulations of the orbital trajectory, allows engineers to guide the spacecraft to a desired entry point without the use of fuel, enabling accurate landing for future payload return missions.

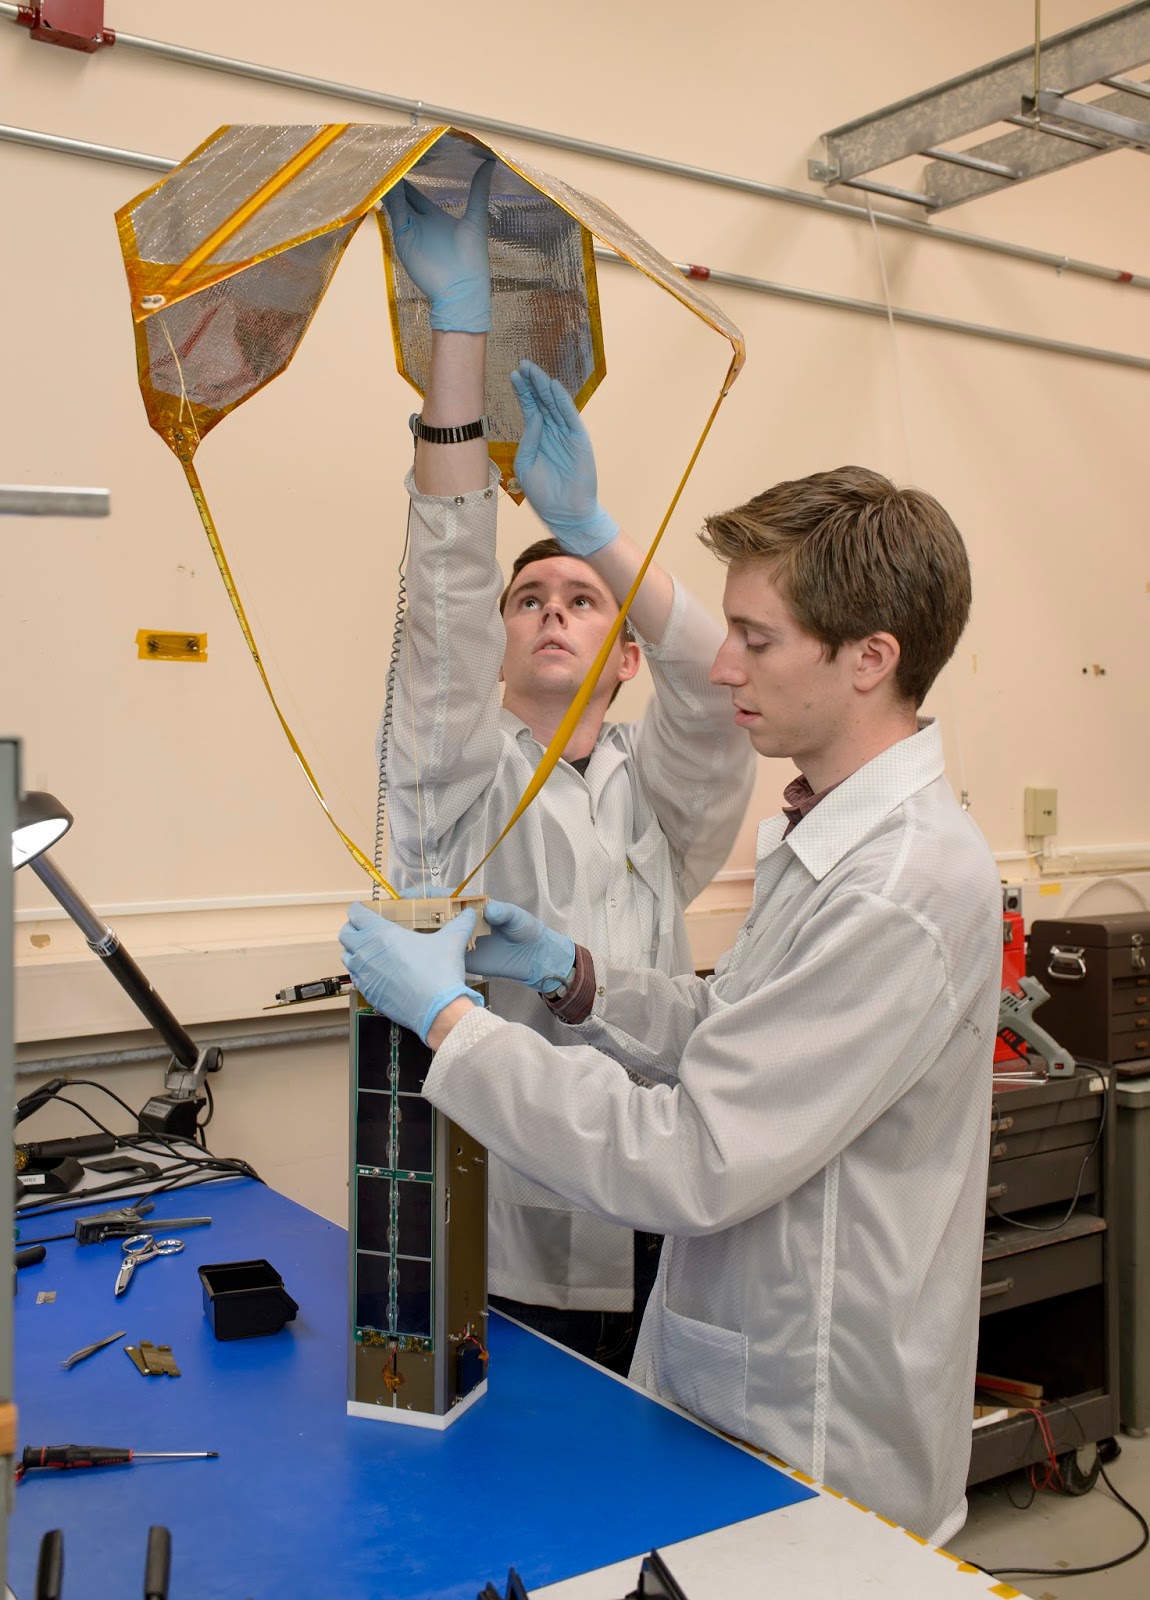
Engineers at NASA’s Ames Research Center in California’s Silicon Valley, have been testing the Exo-Brake technology as a simple design that promises to help bring small payloads back through Earth’s atmosphere unharmed. The technology demonstration mission is a part of the Technology Education (TechEdSat-5) nanosatellite that was launched Dec. 9 on Japan’s H-II Transfer Vehicle from Tanegashima Space Center in Japan. The Exo-Brake will reside on the space station until its deployment in early 2017.


Image above: Engineers pack the Technical Education Satellite (TechEdSat-5) with the Exo-Brake payload. At almost 4 square feet in cross section (0.35 square meters), the Exo-Brake is made of Mylar and is controlled by a hybrid system of mechanic struts and flexible cord. Image Credits: NASA Ames/Dominic Hart.

Since 2012, the Exo-Brake has been tested on balloons and sub-orbital rockets through the Sub-Orbital Aerodynamic Re-entry Experiments, or SOAREX, flight series. Earlier versions of the Exo-Brake and other critical systems also have been tested on orbital experiments on TechEdSat nano-satellite missions.

Two additional technologies will be demonstrated on TechEdSat-5. These include the ‘Cricket’ Wireless Sensor Module (WSM), which provides a unique wireless network for multiple wireless sensors, providing real time data for TechEdSat-5.

TechEdSat-5’s nanosatellite bus element will also utilize the PhoneSat-5 avionics board that uses, for the first time, the versatile Intel Edison microprocessor. The new board is designed to test TechEdSat-5’s unique Wi-Fi capabilities, high fidelity cameras, and contains Iridium L-band transceiver for data.

In addition to the goal of returning samples from the space station, the project seeks to develop “building blocks” for larger scale systems that might enable future small or nanosatellite missions to reach the surface of Mars and other planetary bodies in the solar system.

The Exo-Brake is funded by the Entry Systems Modeling project within the Space Technology Mission Directorate’s Game Changing Development program. Additional funding for the Exo-Brake is provided by NASA Ames Research Center and the NASA Engineering and Safety Center. The TechEdSat series of nanosatellites is a STEM collaborative activity that involves NASA early-career employees, interns and students from several universities including San Jose State University, University of Idaho, University of California at Riverside, and California Polytechnic San Luis Obispo.

For more information on the Game Changing Development program, visit: https://www.nasa.gov/directorates/spacetech/game_changing_development/index.html

For more information on NASA’s small satellite missions, visit: http://www.nasa.gov/smallsats

Images (mentioned), Text, Credits: NASA/Loura Hall/Ames Research Center/Kimberly Williams.

Greetings, Orbiter.ch

Mars Rock-Ingredient Stew Seen as Plus for Habitability


NASA - Mars Science Laboratory (MSL) patch.

Dec. 13, 2016

NASA's Curiosity rover is climbing a layered Martian mountain and finding evidence of how ancient lakes and wet underground environments changed, billions of years ago, creating more diverse chemical environments that affected their favorability for microbial life.


Images above: This pair of drawings depicts the same location at Gale Crater on at two points in time: now and billions of years ago. Water moving beneath the ground, as well as water above the surface in ancient rivers and lakes, provided favorable conditions for microbial life, if Mars has ever hosted life. Images Credits: NASA/JPL-Caltech.

Hematite, clay minerals and boron are among the ingredients found to be more abundant in layers farther uphill, compared with lower, older layers examined earlier in the mission. Scientists are discussing what these and other variations tell about conditions under which sediments were initially deposited, and about how groundwater moving later through the accumulated layers altered and transported ingredients.

Effects of this groundwater movement are most evident in mineral veins. The veins formed where cracks in the layers were filled with chemicals that had been dissolved in groundwater. The water with its dissolved contents also interacted with the rock matrix surrounding the veins, altering the chemistry both in the rock and in the water.

"There is so much variability in the composition at different elevations, we've hit a jackpot," said John Grotzinger, of Caltech in Pasadena, California. He and other members of Curiosity's science team presented an update about the mission Tuesday, Dec. 13, in San Francisco during the fall meeting of the American Geophysical Union. As the rover examines higher, younger layers, researchers are impressed by the complexity of the lake environments when clay-bearing sediments were being deposited, and also the complexity of the groundwater interactions after the sediments were buried.


Image above: The foreground of this scene from the Mastcam on NASA's Curiosity Mars rover shows purple-hued rocks near the rover's late-2016 location. The middle distance includes future destinations for the rover. Variations in color of the rocks hint at the diversity of their composition on lower Mount Sharp. Image Credits: NASA/JPL-Caltech/MSSS.

'Chemical Reactor'

"A sedimentary basin such as this is a chemical reactor," Grotzinger said. "Elements get rearranged. New minerals form and old ones dissolve. Electrons get redistributed. On Earth, these reactions support life."

Whether Martian life has ever existed is still unknown. No compelling evidence for it has been found. When Curiosity landed in Mars' Gale Crater in 2012, the mission's main goal was to determine whether the area ever offered an environment favorable for microbes.

The crater's main appeal for scientists is geological layering exposed in the lower portion of its central mound, Mount Sharp. These exposures offer access to rocks that hold a record of environmental conditions from many stages of early Martian history, each layer younger than the one beneath it. The mission succeeded in its first year, finding that an ancient Martian lake environment had all the key chemical ingredients needed for life, plus chemical energy available for life. Now, the rover is climbing lower on Mount Sharp to investigate how ancient environmental conditions changed over time.

"We are well into the layers that were the main reason Gale Crater was chosen as the landing site," said Curiosity Deputy Project Scientist Joy Crisp of NASA's Jet Propulsion Laboratory, in Pasadena, California. "We are now using a strategy of drilling samples at regular intervals as the rover climbs Mount Sharp. Earlier we chose drilling targets based on each site's special characteristics. Now that we're driving continuously through the thick basal layer of the mountain, a series of drill holes will build a complete picture."

Four recent drilling sites, from "Oudam" this past June through "Sebina" in October, are each spaced about 80 feet (about 25 meters) apart in elevation. This uphill pattern allows the science team to sample progressively younger layers that reveal Mount Sharp's ancient environmental history.

Changing Environments

One clue to changing ancient conditions is the mineral hematite. It has replaced less-oxidized magnetite as the dominant iron oxide in rocks Curiosity has drilled recently, compared with the site where Curiosity first found lakebed sediments. "Both samples are mudstone deposited at the bottom of a lake, but the hematite may suggest warmer conditions, or more interaction between the atmosphere and the sediments," said Thomas Bristow of NASA Ames Research Center, Moffett Field, California. He helps operate the Chemistry and Mineralogy (CheMin) laboratory instrument inside the rover, which identifies minerals in collected samples.

Chemical reactivity occurs on a gradient of chemical ingredients' strength at donating or receiving electrons. Transfer of electrons due to this gradient can provide energy for life. An increase in hematite relative to magnetite indicates an environmental change in the direction of tugging electrons more strongly, causing a greater degree of oxidation in iron.

Another ingredient increasing in recent measurements by Curiosity is the element boron, which the rover's laser-shooting Chemistry and Camera (ChemCam) instrument has been detecting within mineral veins that are mainly calcium sulfate. "No prior mission has detected boron on Mars," said Patrick Gasda of the U.S. Department of Energy's Los Alamos National Laboratory, Los Alamos, New Mexico. "We're seeing a sharp increase in boron in vein targets inspected in the past several months." The instrument is quite sensitive; even at the increased level, boron makes up only about one-tenth of one percent of the rock composition.

'Dynamic System'

Boron is famously associated with arid sites where much water has evaporated away -- think of the borax that mule teams once hauled from Death Valley. However, environmental implications of the minor amount of boron found by Curiosity are less straightforward than for the increase in hematite.

Scientists are considering at least two possibilities for the source of boron that groundwater left in the veins. Perhaps evaporation of a lake formed a boron-containing deposit in an overlying layer, not yet reached by Curiosity, then water later re-dissolved the boron and carried it down through a fracture network into older layers, where it accumulated along with fracture-filling vein minerals. Or perhaps changes in the chemistry of clay-bearing deposits, such as evidenced by the increased hematite, affected how groundwater picked up and dropped off boron within the local sediments.

"Variations in these minerals and elements indicate a dynamic system," Grotzinger said. "They interact with groundwater as well as surface water. The water influences the chemistry of the clays, but the composition of the water also changes. We are seeing chemical complexity indicating a long, interactive history with the water. The more complicated the chemistry is, the better it is for habitability. The boron, hematite and clay minerals underline the mobility of elements and electrons, and that is good for life."


Image above: The top of the rover's mast faces away in this May 11, 2016, self-portrait of NASA's Curiosity Mars rover, which shows the vehicle at the "Okoruso" drilling site on lower Mount Sharp. The scene is a mosaic of multiple images taken with the arm-mounted Mars Hands Lens Imager (MAHLI). Image Credits: NASA/JPL-Caltech/MSSS.

Curiosity is part of NASA's ongoing Mars research and preparation for a human mission to Mars in the 2030s. Caltech manages JPL, and JPL manages the Curiosity mission for NASA's Science Mission Directorate in Washington. For more about Curiosity, visit:

http://www.nasa.gov/msl and http://mars.jpl.nasa.gov/msl/

Learn about NASA’s Journey to Mars at: http://www.nasa.gov/content/nasas-journey-to-mars/

Images (mentioned), Text, Credits: NASA/Laurie Cantillo/Dwayne Brown/Tony Greicius/JPL/Guy Webster/DC Agle/Ames Research Center/Abigail Tabor/Los Alamos National Research Laboratory/Laura Mullane.

Best regards, Orbiter.ch

Eye-Popping View of CO2, Critical Step for Carbon-Cycle Science


NASA - Orbiting Carbon Observatory-2 (OCO-2) logo.

Dec. 13, 2016

A new NASA supercomputer project builds on the agency's satellite measurements of carbon dioxide and combines them with a sophisticated Earth system model to provide one of the most realistic views yet of how this critical greenhouse gas moves through the atmosphere.

Scientists have tracked the rising concentration of heat-trapping carbon dioxide for decades using ground-based sensors in a few places. A high-resolution visualization of the new combined data product – generated by the Global Modeling and Assimilation Office at NASA's Goddard Space Flight Center in Greenbelt, Maryland, using data from the agency's Orbiting Carbon Observatory-2 (OCO-2) satellite build and operated by NASA’s Jet Propulsion Laboratory in Pasadena, California – provides an entirely different perspective.

The 3-D visualization reveals in startling detail the complex patterns in which carbon dioxide in the atmosphere increases, decreases and moves around the globe over the course of September 2014 to September 2015.

Following Carbon Dioxide Through the Atmosphere

Video above: Carbon dioxide plays a significant role in trapping heat in Earth's atmosphere. The gas is released from human activities like burning fossil fuels, and the concentration of carbon dioxide moves and changes through the seasons. Using observations from NASA's Orbiting Carbon Observatory (OCO-2) satellite, scientists developed a model of the behavior of carbon in the atmosphere from Sept. 1, 2014, to Aug. 31, 2015. Scientists can use models like this one to better understand and predict where concentrations of carbon dioxide could be especially high or low, based on activity on the ground. Video Credits: NASA's Goddard Space Flight Center/K. Mersmann, M. Radcliff, producers.

Atmospheric carbon dioxide acts as Earth's thermostat. Rising concentrations of the greenhouse gas, due primarily to the burning of fossil fuels for energy, have driven Earth's current long-term warming trend. The visualization highlights the advances scientists are making in understanding the processes that control how much emitted carbon dioxide stays in the atmosphere and how long it stays there – questions which ultimately will determine Earth's future climate.

Scientists know that nearly half of all human-caused emissions are absorbed by the land and ocean. The current understanding is that about 50 percent of emissions remain in the atmosphere, about 25 percent are absorbed by vegetation on the land, and about 25 percent are absorbed by the ocean. However, those seemingly simple numbers leave scientists with critical and complex questions: Which ecosystems, especially on land, are absorbing what amounts of carbon dioxide? Perhaps most significantly, as emissions keep rising, will the land and the ocean continue this rate of absorption, or reach a point of saturation?

The new dataset is a step toward answering those questions, explained Lesley Ott, a carbon cycle scientist at NASA Goddard and a member of the OCO-2 science team. Scientists need to understand the processes driving the "carbon flux" – the exchange of carbon dioxide among the atmosphere, land and ocean, Ott said.

Orbiting Carbon Observatory-2 (OCO-2) satellite. Image Credit: NASA

"We can't measure the flux directly at high resolution across the entire globe," she said. "We are trying to build the tools needed to provide an accurate picture of what's happening in the atmosphere and translating that to an accurate picture of what's going on with the flux. There's still a long way to go, but this is a really important and necessary step in that chain of discoveries about carbon dioxide."

OCO-2, launched in 2014, is NASA's first satellite designed specifically to measure atmospheric carbon dioxide at regional scales.

"Since September of 2014, OCO-2 has been returning almost 100,000 carbon dioxide estimates over the globe each day," said David Crisp, OCO-2 project scientist. "Modeling tools like those being developed by our colleagues in the Global Modeling and Assimilation Office are critical for analyzing and interpreting this high resolution dataset."

The Global Modeling and Assimilation Office has previously included carbon dioxide in its GEOS Earth System model, which is used for all manner of atmospheric studies. This new product builds on that work by using the technique of data assimilation to combine the OCO-2 observations with the model. “Data assimilation is the process of blending model simulations with real world measurements with the precision, resolution and coverage needed to reflect our best understanding of the exchange of carbon dioxide between the surface and atmosphere,” explained Brad Weir, a researcher based in the GMAO.

The visualization showcases information about global carbon dioxide fields that has not been seen before in such detail: The rise and fall of carbon dioxide in the Northern Hemisphere throughout a year; the influence of continents, mountain ranges and ocean currents on weather patterns and therefore carbon dioxide movement; the regional influence of highly active photosynthesis in places like the Corn Belt in the U.S.

While the finely detailed carbon dioxide fluctuations are eye-catching, they also remind Global Modeling and Assimilation Office chief Steven Pawson of the progress scientists are making with computer models of the Earth system. One future step will be to integrate a more complex biology module into the model to better target the questions of carbon dioxide absorption and release by forests and other land ecosystems.

The results highlighted here demonstrate the value of NASA’s unique capabilities in observing and modeling Earth. It also emphasizes the collaboration among NASA centers and the value of powerful supercomputing. The assimilation was created using a model called the Goddard Earth Observing System Model-Version 5 (GEOS-5), which was run by the Discover supercomputer cluster at Goddard's NASA Center for Climate Simulation.

"It's taken us many years to pull it all together," Pawson said. "The level of detail included in this dataset gives us a lot of optimism that our models and observations are beginning to give a coherent view of the carbon cycle."

Related Links:

NASA’s AGU website: http://www.nasa.gov/agu

NASA's OCO-2 website: https://www.nasa.gov/mission_pages/oco2/index.html

Image (mentioned), Video (mentioned), Text, Credits: NASA's Goddard Space Flight Center, by Patrick Lynch/Rob Garner.

Greetings, Orbiter.ch

Japan’s “White Stork” Spacecraft Installed on Station


JAXA -  H-IIB Launch Vehicle No. 6 & (HTV-6) KOUNOTORI-6 Mission patch.

December 13, 2016


Image above: Japan’s HTV-6 cargo craft is installed to the Harmony module’s Earth-facing port. There are now four spacecraft parked at the International Space Station, including two Soyuz crew vehicles and one Progress resupply ship. Image Credit: NASA.

Ground controllers successfully installed the Japan Aerospace Exploration Agency (JAXA) Kounotori 6 H-II Transfer Vehicle (HTV-6) to the International Space Station’s Earth-facing port of the Harmony module at 8:57 a.m. EST.

The spacecraft’s arrival supports the crew members’ research off the Earth to benefit the Earth. The cargo spacecraft began its trip on an H-IIB rocket at 8:26 a.m. EST (10:26 p.m. Japan time) on Friday, Dec. 9 from the Tanegashima Space Center in southern Japan.

Japanese Cargo Ship Attached to the International Space Station

The early Tuesday morning cargo delivery includes more than 4.5 tons of supplies, water, spare parts and experiment hardware.

Join the conversation on Twitter by following @Space_Station. To learn more about all the ways to connect and collaborate with NASA, visit: http://www.nasa.gov/connect.

For more information on previous HTV missions from JAXA to the space station visit:

    https://www.nasa.gov/feature/kounotori-htv-launches-arrivals-and-departures
    https://www.flickr.com/photos/nasa2explore/albums/72157657507783606

Related articles:

Two Astronauts Capture Japanese “White Stork”
http://orbiterchspacenews.blogspot.ch/2016/12/two-astronauts-capture-japanese-white.html

Launch success of the H-IIB Launch Vehicle No. 6 (H-IIB F6) HTV-6
http://orbiterchspacenews.blogspot.ch/2016/12/launch-success-of-h-iib-launch-vehicle.html

International Space Station (ISS): https://www.nasa.gov/mission_pages/station/main/index.html

Space Station Research and Technology: https://www.nasa.gov/mission_pages/station/research/index.html

Image (mentioned), Video (NASA TV), Text, Credits: NASA/Mark Garcia.

Best regards, Orbiter.ch

NASA Communications Network to Double Space Station Data Rates


NASA - Tracking and Data Relay Satellites (TDRS) logo.

Dec. 13, 2016

 International Space Station (ISS). Image Credit: NASA

Life aboard the International Space Station depends upon massive amounts of data, used for everything from commanding the station to providing real-time high-definition video and data on hundreds of science and technology experiments, to giving live TV interviews with astronauts. Every bit of that data travels to Earth via the Space Network, and starting soon, the network will transmit double the data in a single second than it ever has before.

The Space Network (SN), composed of a constellation of Tracking and Data Relay Satellites (TDRS) and their associated ground stations, provides communication services to some of NASA’s most storied spacecraft, including the International Space Station.

Data Flow from Space to the Ground via NASA’s Space Network

Video above: NASA’s Space Network is the primary communications service provider for the International Space Station. In this animation, the Space Network uses a constellation of Tracking and Data Relay Satellites (TDRS) to collect data from the International Space Station. Once received, the TDRS relays that data back to the Space Network’s ground terminal in White Sands, New Mexico. Data is then routed to mission control at NASA’s Johnson Space Center in Houston. Video Credits: NASA's Goddard Space Flight Center/Amber Jacobson, producer.

Currently, the SN provides connectivity to and from the station at 300 megabits per second (Mbps), twice the rate of a typical high-speed internet connection in American homes. The station transmits data to whichever TDRS spacecraft is in view, which, in turn, transmits it to ground terminals before it reaches a data center like mission control in Houston. The increased data rate will support new, more sophisticated instruments that require a greater data flow.

“Fundamentally, this upgrade of both the onboard and ground data communications systems enables an increase in the scientific output from the space station,” said Mark Severance, network director of human spaceflight at NASA’s Goddard Space Flight Center in Greenbelt, Maryland. “Increasing the data downlink rates from the station will allow the manifestation of new experiments and technology demonstrations that have higher data-rate requirements than could previously be accommodated.”

Increasing the data rate begins at the Space Network’s remote ground terminal in Guam. The SN team installed a 300 Mbps data downlink capability at the Guam facility to increase data-flow capability to and from the station to the current standard. They will now install upgraded hardware at the White Sands, New Mexico, and Guam ground terminals to enable the space station to double its data return.

Data transmitted by the station includes time-sensitive, mission-critical data like information about the crew’s health, the status of the station’s systems, results from onboard science experiments, as well as every single social media post and interview. Flight controllers at NASA’s Johnson Space Center in Houston receive the station’s tracking and command data primarily from the SN.


Image above: NASA operates three Space Network ground terminals. Pictured here, the White Sands ground terminal at NASA’s White Sands Test Facility in Las Cruces, New Mexico, was opened in 1981 ahead of the first TDRS launch in 1983. This terminal will be upgraded as part of the effort to double the space station’s data rates. Image Credits: NASA/W.R. Gardner.

In addition to the space station, the SN makes connections, recorded as “events,” with more than 40 other NASA missions, including the Hubble Space Telescope. In total, the Space Network handles more than 900,000 minutes of data a month with over 13,000 communication events. This equates to, on average, 28 terabytes of information every day, which is about 1,100 single layered Blu-ray discs.

“The project is committed to evolving the Space Network to enable new mission concepts by simplifying customer interfaces, increasing customer data rates, and enabling new concepts of operations,” said Ted Sobchak, SN project manager.

The SN will add another TDRS spacecraft to its fleet in 2017. TDRS-M is scheduled to launch from Cape Canaveral, Florida, aboard a United Launch Alliance Atlas-V launch vehicle in late summer. Upon completion of on-orbit testing, (about six months) TDRS-M will be renamed. Built by Boeing, TDRS-M will greatly increase network capacity and flexibility.

At the same time, the Space Network Ground Segment Sustainment project is working to bring the Space Network’s ground terminals into the 21st century. The team has been working to implement a new architecture that allows the network to accommodate new users and capabilities. An added bonus includes reducing the effort required to operate and maintain the system, a potential savings in operation costs.

NASA’s Space Communications and Navigation (SCaN) Program Office, a division of the Human Exploration and Operations Mission Directorate at NASA Headquarters in Washington, provides programmatic oversight of NASA’s networks, advanced communication technologies, and other space communication requirements. These capabilities form the backbone of all NASA missions, providing critical connectivity from spacecraft to ground.

SCaN provides the strategic guidance necessary to ensure NASA’s space communication resources continue to meet the needs of their customers and the agency for years to come. SCaN is actively engaged in the wider international community dedicated to interoperability and compatibility for space communications and navigation.

For more information about SCaN and these projects:

NASA’s Space Communications and Navigation program office: https://www.nasa.gov/directorates/heo/scan/index.html

Space Network: http://www.nasa.gov/directorates/heo/scan/services/networks/txt_sn.html

Tracking and Data Relay Satellite system: https://tdrs.gsfc.nasa.gov/

Space Network Ground Segment Sustainment project: https://esc.gsfc.nasa.gov/space-communications/sgss.html

Tracking and Data Relay Satellites (TDRS): https://tdrs.gsfc.nasa.gov/

International Space Station (ISS): https://www.nasa.gov/mission_pages/station/main/index.html

Images (mentioned), Video (mentioned), Text, Credits: NASA’s Goddard Space Flight Center, by Amber Jacobson and Ashley Hume/Rob Garner.

Greetings, Orbiter.ch