mardi 14 mars 2017

Could Leftover Heat from Last El Niño Fuel a New One?


NASA & CNES - Jason-3 Mission logo.

March 14, 2017

Some climate models are suggesting that El Niño may return later this year, but for now, the Pacific Ocean lingers in a neutral "La Nada" state, according to climatologist Bill Patzert of NASA’s Jet Propulsion Laboratory, Pasadena, California. The latest map of sea level height data from the U.S./European Jason-3 satellite mission shows most of the ocean at neutral heights (green), except for a bulge of high sea level (red) centered along 20 degrees north latitude in the central and eastern Northern Hemisphere tropics, around Hawaii. This high sea level is caused by warm water.

Whether or not El Niño returns will be determined by a number of factors, one of which is the larger stage on which El Niño and La Niña play, the Pacific Decadal Oscillation (PDO). The PDO is a large-scale, long-term pattern of ocean temperature and other changes in the Pacific Ocean. It alternates between two phases, warm (called positive) and cool (negative), at irregular intervals of 5 to 20 years.


Image above: Data collected Feb. 28 – March 12, 2017, by the U.S./European Jason-3 satellite show near-normal ocean surface heights in green, warmer areas in red and colder areas in blue. Ocean surface height is related in part to its temperature, and thus is an indicator of how much heat is stored in the upper ocean. Image Credits: NASA/JPL-Caltech.

The phases of the PDO are known to affect the size and frequency of the shorter-term El Niño and La Niña events. In its positive phase, the PDO encourages and intensifies El Niños. In its negative phase, it does the same for La Niñas. The last PDO phase shift was in 2014, when it turned strongly positive and has remained that way for 37 months.

Patzert says a look back over the three years since the PDO's 2014 phase shift provides some clues about why the 2015-16 El Niño was so large and long-lasting, and why the 2016 La Niña was so small.

In 2014, Patzert says, the trade winds (the prevailing winds that blow from east to west over Earth’s tropical oceans) in the Pacific Ocean weakened, and a modest El Niño waxed and waned throughout the year. It never fully developed, but it left the equatorial Pacific warmer than normal. In 2015, the trade winds dramatically weakened, triggering a big El Niño with major worldwide impacts. With a large pool of warm equatorial water to draw on, it formed early and strengthened for more than a year, reaching full strength in late January 2016 -- unusually late for an El Niño event.

Besides being long-lived, the 2015-16 El Niño was also unusually large in area, with high sea levels and warm water spreading as far north as Hawaii. As the main region of the El Niño waned, this warm bulge north of the equator remained.

During the summer of 2016, a La Niña was thought to be imminent, but it never truly took hold. By November 2016, the equatorial Pacific Ocean was in the neutral condition it remains in now. The high sea level visible as a red area around Hawaii in the new image is caused by warmth left over from the last El Niño.

Patzert postulates that the leftover warm-water bulge was responsible for the lackluster La Niña. "Did the warm bulge suppress the trade winds in the eastern and central Pacific, muting the conditions required for a full-blown La Niña to form?" he asks. "As all El Niño researchers know, no two El Niño or La Niña episodes are exactly the same."

Jason-3 satellite. Image Credit: NASA

Patzert and other researchers have additional questions about the PDO’s influence. What role did the 2014 PDO phase shift play in the events of the last three years? Does the ongoing ocean warmth signal that the current positive PDO phase will be long lasting -- perhaps decadal -- or will it be a shorter-term blip? NASA scientists will continue to monitor the Pacific to see what's in store next for the world's climate.

Either way, Patzert notes, the PDO will be a factor in future climate patterns. "A warmer or cooler Pacific Ocean will certainly play a big role in future El Niño and La Niña events. That's important, because these events modulate drought and deluge patterns in the American West, as well as the rate of climbing global temperatures," he says.

For a time sequence of the evolution of Pacific Ocean sea surface heights from 2014 to the present, see: http://sealevel.jpl.nasa.gov/science/elninopdo/latestdata/archive/

To learn more about NASA's satellite altimetry programs: http://sealevel.jpl.nasa.gov

For more on NASA's Earth science activities, visit: http://www.nasa.gov/earth

For more information about Jason-3, visit: https://sealevel.jpl.nasa.gov/missions/jason3/ and https://jason-3.cnes.fr/

Images (mentioned), Text, Credits: NASA/Tony Greicius/JPL/Alan Buis.

Greetings, Orbiter.ch

Weekly Recap From the Expedition Lead Scientist, week of March 6, 2017


ISS - Expedition 50 Mission patch.

March 14, 2017

(Highlights: Week of March 6, 2017) -- Scientists monitored a lot of activity on the outside of the International Space Station, beginning with the attachment of an important Earth observation payload on the station's exterior surface.

The Stratospheric Aerosol and Gas Experiment (SAGE III) is a key part of NASA’s mission to provide crucial, long-term measurements that will help humans understand and care for Earth’s atmosphere. Ground crews used a remote-controlled robotic arm to mount the experiment to the station's hull for power-up and checkout. SAGE III measures Earth's ozone, along with other gases and aerosols, in the atmosphere. The device takes measurements by observing the atmosphere on edge with the light of the sun or the moon shining through it.


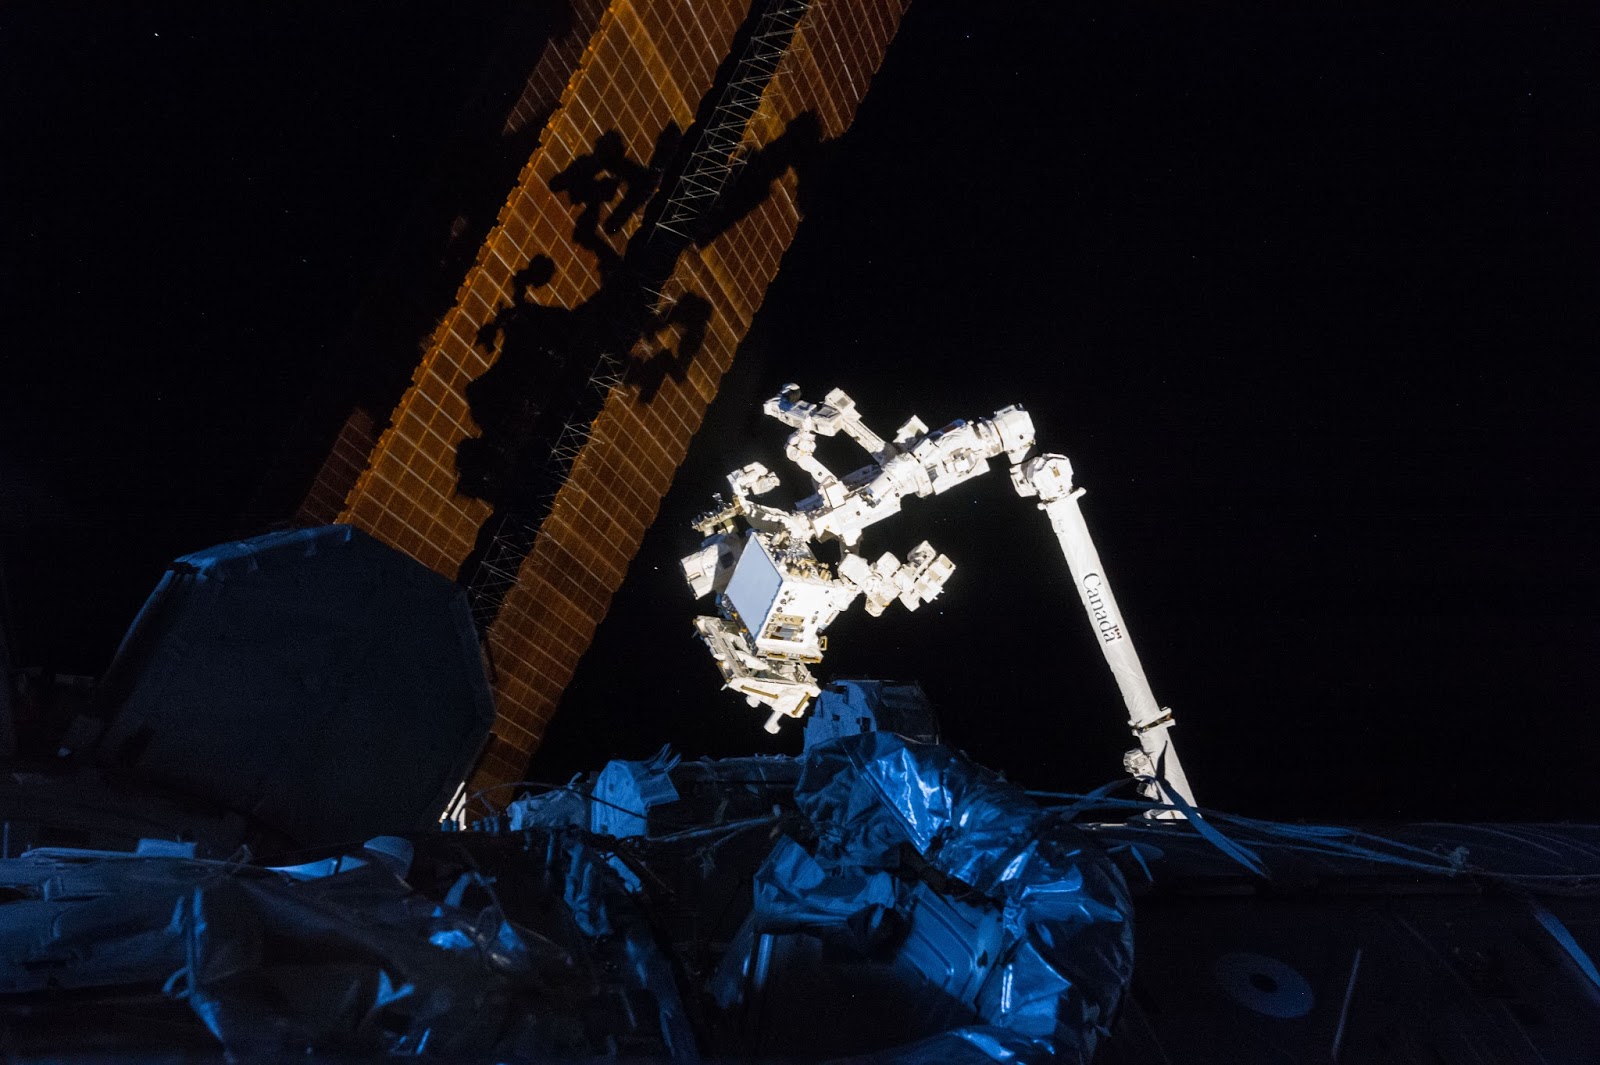
Image above: The Robotic Refueling Mission is removed from the exterior of the International Space Station using a remotely controlled robot arm. The investigation tested tools and procedures to service and repair satellites in space. The payload was stowed in the Dragon spacecraft for return to Earth. Image Credit: NASA.

When ozone breaks down, all inhabitants on Earth are affected. Humans, plants and animals are exposed to more harmful rays from the sun, which can cause long-term problems including cancer in humans and reduced crop yield. Data from the sensors on board will provide valuable insight to the stability of our atmosphere, but may also supply important information to future spacecraft designers and engineers about operating in the space environment.

A series of satellites were jettisoned from the station using the NanoRack CubeSat Deployer (NRCSD). Six LEMUR-2 satellites were released to help track ships on the open sea and monitor weather. They join a constellation of satellites that will eventually observe all the world's oceans. Two Technology Education Satellites (TechEdSat) were also deployed to study a new system called the Exo-Brake, which uses a spacecraft's own atmospheric drag to change its velocity and adjust its approach.


Image above: The APEX-04 experiment is growing the model plant Arabidopsis thaliana, or thale cress, in the Veggie facility, a low-cost plant growth chamber using a flat-panel light bank for plant growth and observation. Image Credit: NASA.

The NRCSD is a self-contained deployment system on the end of a robotic arm, called the JEM Remote Manipulator System (JEMRMS), mounted to the exterior of the station. It is a rectangular compartment that "ejects" very small satellites to place them into orbit. It provides a low-cost and frequent flight opportunity for industry and academia to place research satellites into space.

NASA astronauts Peggy Whitson and Shane Kimbrough harvested a series of small plants grown on petri plates as part of the APEX-04 investigation. The plants were inserted into the Minus Eighty Degree Celsius Laboratory Freezer for ISS (MELFI) for return on the Dragon capsule. Whitson then configured the facility for the next four-day growing cycle. The plants from the second cycle will be harvested and imaged under a microscope on the station.


Image above: Brooke Thornton, SAGE III Mission Operations Manager, directing the Mission Operations team at NASA LaRC during SAGE III Installation. Image Credit: NASA.

The study continues a highly successful investigation into the effects of microgravity on the development of roots and cells of plant seedlings. This particular experiment is growing the model plant Arabidopsis thaliana, or thale cress, in the Veggie facility, a low-cost plant growth chamber using a flat-panel light bank for plant growth and observation. After a short growth period, the plants are photographed, harvested and preserved for detailed analysis on Earth. This investigation studies the entire genome of thale cress plants grown in space, creating DNA maps of spaceflight-specific changes in certain groups of genes. Results will give new insight into plants’ molecular responses to spaceflight, which benefits efforts to grow plants in space for food and oxygen. Agricultural practices and bioenergy research on Earth may also benefit, helping design crops that can use resources, such as water and nutrients in the soil, more efficiently.

Other human research investigations conducted this week include Biochemical Profile, Body Measures, Energy, Lighting Effects, Fluid Shifts, Habitability, Space Headaches, and Dose Tracker.

Progress was made on other investigations, outreach activities, and facilities this week, including Auxin Transport, Meteor, Tropical Cyclone, Microgravity Expanded Stem Cells, Rodent Research-4, ISS Ham Radio, Group Combustion, EML Batch 1, MAGVECTOR, BEAM, Radi-N2, Manufacturing Device, ExHAM #2 and NanoRacks Module-9.

Related links:

Stratospheric Aerosol and Gas Experiment (SAGE III): https://www.nasa.gov/mission_pages/station/research/experiments/1004.html

NanoRack CubeSat Deployer (NRCSD): http://www.nasa.gov/mission_pages/station/research/experiments/1350.html

LEMUR-2 satellites: https://www.nasa.gov/mission_pages/station/research/experiments/2349.html

Technology Education Satellites (TechEdSat): https://www.nasa.gov/mission_pages/station/research/experiments/1027.html

APEX-04 investigation: https://www.nasa.gov/mission_pages/station/research/experiments/1762.html

Minus Eighty Degree Celsius Laboratory Freezer for ISS (MELFI): https://www.nasa.gov/mission_pages/station/research/experiments/58.html

Veggie: http://www.nasa.gov/mission_pages/station/research/news/veggie

Biochemical Profile: https://www.nasa.gov/mission_pages/station/research/experiments/1008.html

Body Measures: https://www.nasa.gov/mission_pages/station/research/experiments/1070.html

Energy: https://www.nasa.gov/mission_pages/station/research/experiments/397.html

Lighting Effects: https://www.nasa.gov/mission_pages/station/research/experiments/2279.html

Fluid Shifts: https://www.nasa.gov/mission_pages/station/research/experiments/1257.html

Habitability: https://www.nasa.gov/mission_pages/station/research/experiments/1772.html

Space Headaches: https://www.nasa.gov/mission_pages/station/research/experiments/181.html

Dose Tracker:
http://www.nasa.gov/mission_pages/station/research/experiments/1933.html

Auxin Transport: https://www.nasa.gov/mission_pages/station/research/experiments/1991.html

Meteor: https://www.nasa.gov/mission_pages/station/research/experiments/1323.html

Tropical Cyclone: https://www.nasa.gov/mission_pages/station/research/experiments/1973.html

Microgravity Expanded Stem Cells: https://www.nasa.gov/mission_pages/station/research/experiments/1971.html

Rodent Research-4: https://www.nasa.gov/mission_pages/station/research/experiments/2025.html

ISS Ham Radio: http://www.nasa.gov/mission_pages/station/research/experiments/346.html

Group Combustion: https://www.nasa.gov/mission_pages/station/research/experiments/1077.html

MAGVECTOR: https://www.nasa.gov/mission_pages/station/research/experiments/1176.html

BEAM: https://www.nasa.gov/mission_pages/station/research/experiments/1804.html

Radi-N2: https://www.nasa.gov/mission_pages/station/research/experiments/898.html

Space Station Research and Technology: https://www.nasa.gov/mission_pages/station/research/index.html

International Space Station (ISS): https://www.nasa.gov/mission_pages/station/main/index.html

Images (mentioned), Text, Credits: NASA/Kristine Rainey/Jorge Sotomayor, Lead Increment Scientist Expeditions 49 & 50.

Best regards, Orbiter.ch

Farewell to Mimas


NASA - Cassini Mission to Saturn patch.

March 14, 2017


In its season of "lasts," NASA's Cassini spacecraft made its final close approach to Saturn's moon Mimas on January 30, 2017. At closest approach, Cassini passed 25,620 miles (41,230 kilometers) from Mimas. All future observations of Mimas will be from more than twice this distance.

This mosaic is one of the highest resolution views ever captured of the icy moon.

Close approaches to Mimas have been somewhat rare during Cassini's mission, with only seven flybys at distances of less than 31,000 miles (50,000 kilometers).

Mimas' surface is pockmarked with countless craters, the largest of which gives the icy moon its distinctive appearance. (See PIA12568 for more info on Mimas' distinctive crater, Herschel.)

Two versions of the mosaic are provided. In one, the left side, which is lit by reflected light from Saturn, has been enhanced in brightness in order to show the full surface. The second version features more natural illumination levels.

Imaging scientists combined ten narrow-angle camera images to create this mosaic view. The scene is an orthographic projection centered on terrain at 17.5 degrees south latitude, 325.4 degrees west longitude on Mimas. An orthographic view is most like the view seen by a distant observer looking through a telescope.

This mosaic was acquired at a distance of approximately 28,000 miles (45,000 kilometers) from Mimas. Image scale is approximately 820 feet (250 meters) per pixel. The images were taken in visible light with the Cassini spacecraft narrow-angle camera on Jan. 30, 2017.

The Cassini mission is a cooperative project of NASA, ESA (the European Space Agency) and the Italian Space Agency. The Jet Propulsion Laboratory, a division of the California Institute of Technology in Pasadena, manages the mission for NASA's Science Mission Directorate, Washington. The Cassini orbiter and its two onboard cameras were designed, developed and assembled at JPL. The imaging operations center is based at the Space Science Institute in Boulder, Colorado.

Related article:

The Big One
http://orbiterchspacenews.blogspot.ch/2017/03/the-big-one.html

Related link:

PIA12568: http://photojournal.jpl.nasa.gov/catalog/PIA12568

For more information about the Cassini-Huygens mission visit http://saturn.jpl.nasa.gov and http://www.nasa.gov/cassini. The Cassini imaging team homepage is at http://ciclops.org and http://www.esa.int/Our_Activities/Space_Science/Cassini-Huygens

Image, Text, Credits: NASA/Tony Greicius/JPL-Caltech/Space Science Institute.

Greetings, Orbiter.ch

lundi 13 mars 2017

NASA, NOAA Satellites See Winter Storm Madness "March" to the East


NOAA & NASA - GOES Program logo.

March 13, 2017

NASA and NOAA satellites are providing various views of the major winter storm marching toward the U.S. East coast on March 13. The storm is forecast to merge with another system and is expected to bring large snowfall totals from the Mid-Atlantic to New England.


Image above: NOAA's GOES-East satellite captured the clouds associated with two low pressure areas coming together on March 13 at 1715 UTC (1:15 p.m. EST). Image Credits: NASA/NOAA GOES Project.

NASA's Aqua satellite gathered infrared data from the storm system and the area ahead of the storm for cloud and ground temperatures. NOAA's GOES-East satellite provided visible and infrared imagery that showed the extent and the movement of the system.

Forecasters at the National Weather Service's Weather Prediction Center (WPC) noted that the low pressure system crossing the Midwest states and Ohio Valley is expected to merge with another low off the southeast U.S. coast. WPC stated "This will allow for a strong nor'easter to develop near the coast and cause a late-season snowstorm from the central Appalachians to New England, including many of the big cities in the Northeast U.S."

An Infrared Look at the Storm

Infrared light provides scientists with temperature data and that's important when trying to understand the strength of storms. When it comes to snow storms, both ground temperature and cloud top temperatures are important. The higher the cloud tops the colder they are, and stronger the storm. Infrared data, such as that gathered by the AIRS instrument aboard NASA's Aqua satellite, can provide that important information.


Image above: NASA's Aqua satellite captured this infrared view of the Eastern U.S. on March 13 at 07:35 UTC (3:35 a.m. EST) and detected some strong storms (purple) with cloud top temperatures as cold as -63F (-53C) stretching from Michigan southwest through Illinois and into southeastern Missouri and northwestern Arkansas. Image Credits: NASA JPL, Ed Olsen.

When NASA's Aqua satellite flew over the eastern U.S. on March 13 at 07:35 UTC (3:35 a.m. EST), it took a reading of ground and cloud top temperatures. AIRS detected some strong storms with cloud top temperatures as cold as minus 63 degrees Fahrenheit (minus 53 degrees Celsius) stretching from Michigan southwest through Illinois and into southeastern Missouri and northwestern Arkansas. Those storms have the capability to produce heavy precipitation, which in this case would be heavy snowfall rates. 

AIRS data also showed the temperatures at the surface on the East coast (and ahead of the Midwest system) were as cold as 270 kelvin or 26.33 degrees Fahrenheit (minus 3.15 degrees Celsius). That's cold enough for snow to stick on the ground.

Making a Satellite Movie of the Storm

The path of the Midwest low pressure system was captured in a NASA animation or movie using infrared and visible imagery from NOAA's Geostationary Operational Environmental or GOES East satellite. The imagery spanned two days from March 11 through March 13 at 1715 UTC (1:15 p.m. EST).

March 2017 Massive East Coast Snow Storm

Video above: This GOES-East animation from March 11 to March 13 at 1715 UTC (1:15 p.m. EST) shows the Midwest storm system moving toward the U.S. East coast. Video Credits: NASA/NOAA GOES Project.

To create the video and imagery, NASA/NOAA's GOES Project located at NASA's Goddard Space Flight Center in Greenbelt, Maryland overlays the cloud data from NOAA's GOES-East satellite on a true-color image of land and ocean created by data from the Moderate Resolution Imaging Spectroradiometer, or MODIS, instrument that flies aboard NASA's Aqua and Terra satellites. Together, these data create the entire animation of the storm and show its movement.

GOES satellites provide the kind of continuous monitoring necessary for intensive data analysis. Geostationary describes an orbit in which a satellite is always in the same position with respect to the rotating Earth. This allows GOES to hover continuously over one position on Earth's surface, appearing stationary.

National Weather Service Prediction

On Monday, March 13, 2017 the National Weather Service noted: "A powerful nor'easter will bring very heavy snow, ice, strong winds, and dangerous travel conditions from the Middle Atlantic to New England through Tuesday. The heaviest snowfall is expected to occur from the northern Middle Atlantic to Southern New England where 12 to 18 inches can be expected with localized amounts up to 2 feet. Strong winds could down trees and cause power outages."

According to NWS, in those areas closer to the coast from southern New Jersey to the Carolinas, rain is expected with amounts in excess of an inch likely.

For updated information about the storm system, visit NOAA's NWS website: http://www.weather.gov

For more information about GOES satellites, visit: http://www.goes-r.gov/ or http://goes.gsfc.nasa.gov/

Images (mentioned), Video (mentioned), Text, Credits: NASA's Goddard Space Flight Center/Rob Gutro/Lynn Jenner.

Greetings, Orbiter.ch

Enceladus' south pole is warm under the frost


ESA - Cassini Mission to Saturn logo.

March 13, 2017

Over the past decade, the international Cassini mission has revealed intense activity at the southern pole of Saturn's icy moon, Enceladus, with warm fractures venting water-rich jets that hint at an underground sea. A new study, based on microwave observations of this region, shows that the moon is warmer than expected just a few metres below its icy surface. This suggests that heat is produced over a broad area in this polar region and transported under the crust, and that Enceladus's reservoir of liquid water might be lurking only a few kilometres beneath.

In 2005, observations by the NASA/ESA/ASI Cassini mission revealed plumes of water vapour and ice spraying into space from the south pole of Enceladus, the sixth-largest moon of Saturn. These jets originate from the so-called 'tiger stripes' – four warm fractures in the moon's icy surface. The salty composition of these jets points to an underground sea of liquid water that might interact with Enceladus's rocky core, similar to the sub-surface ocean that is thought to exist on Jupiter's moon, Europa.

Many of Cassini's flybys of Enceladus have been dedicated to understanding the structure of the interior of this fascinating body and its potentially habitable water reservoir. Now, a study based on data collected during a close flyby in 2011 indicates that the moon's hidden sea might be closer to the surface than previously thought.


Image above: False-colour image of Enceladus highlighting the tiger stripes in blue. Image Credit: NASA/JPL/Space Science Institute.

"During this flyby, we obtained the first and, unfortunately, only high-resolution observations of Enceladus's south pole at microwave wavelengths," says Alice Le Gall from Laboratoire Atmosphères, Milieux, Observations Spatiales (LATMOS), and Université Versailles Saint-Quentin (UVSQ), France. Alice is an associate member of the Cassini RADAR instrument team and the lead scientist of the new study, published today in Nature Astronomy.

"These observations provide a unique insight into what is going on beneath the surface. They show that the first few metres below the surface of the area that we investigated, although at a glacial 50-60 K, are much warmer than we had expected: likely up to 20 K warmer in some places," she adds

"This cannot be explained only as a result of the Sun's illumination and, to a lesser extent, Saturn’s heating so there must be an additional source of heat."

The detected heat appears to be lying under a much colder layer of frost, as no similar anomaly was found in infrared observations of the same region – these probe the temperature of the surface but are not sensitive to what is underneath.

The observations used by Alice and her collaborators cover a narrow, arc-shaped swathe of the southern polar region, about 500 km long and 25 km wide, and located just 30 km to 50 km north of the tiger-stripe fractures. Because of operational constraints of the 2011 flyby, it was not possible to obtain microwave observations of the active fractures themselves. This had the benefit of allowing the scientists to observe that the thermally anomalous terrains of Enceladus extend well beyond the tiger stripes.


Image above: Tiger stripes on the south pole of Enceladus. The region studied is indicated by the coloured band. Image Credit: NASA/JPL-Caltech/Space Science Institute.

"The thermal anomaly we see at microwave wavelengths is especially pronounced over three fractures that are not unlike the tiger stripes, except that they don't seem to be the source of jets at the moment," Alice says.

These seemingly dormant fractures lying above the warm, underground sea point to a dynamic character of Enceladus's geology: the moon may have experienced several episodes of activity at different locations during its past history.

Even if the observations cover only a small patch of the southern polar terrains, it is likely that the entire region is warm underneath and Enceladus's ocean could be a mere 2 km under the icy surface. The finding agrees well with the results of a recent study, led by Ondrej Cadek and published in 2016, which estimated the thickness of the crust on Enceladus. With an average depth of 18–22 km, the ice shell appears to reduce to less than 5 km at the south pole.

Alice and her collaborators think that the underground heating source is linked to the tidal cycle of the moon along its eccentric orbit around Saturn. This induces stress compressions and deformations on the crust, leading to the formation of faults and fractures while at the same time heating up the sub-surface layers. In this scenario, the thinner icy crust in the south pole region is subject to a larger tidal deformation that, in turn, releases more heat and contributes to maintaining the underground water in liquid form.

"This discovery opens new perspectives to investigate the emergence of habitable conditions on the icy moons of the gas giant planets," says Nicolas Altobelli, ESA's Project Scientist for Cassini–Huygens.

"If Enceladus's underground sea is really as close to the surface as this study indicates, then a future mission to this moon carrying an ice-penetrating radar sounding instrument might be able to detect it."

Notes for Editors:

"Thermally anomalous features in the subsurface of Enceladus’s south polar terrain" by A. Le Gall et al. (2017) is published in Nature Astronomy: http://www.nature.com/articles/s41550-017-0063

Cassini–Huygens is a cooperative project of NASA, ESA and ASI, the Italian space agency.

Related link:

Cassini RADAR instrument: https://saturn.jpl.nasa.gov/radio-detection-and-ranging/

For more information about Cassini, visit: http://www.nasa.gov/cassini and http://saturn.jpl.nasa.gov and http://www.esa.int/Our_Activities/Space_Science/Cassini-Huygens

Images (mentioned), Text, Credits: ESA/Nicolas Altobelli/Laboratoire Atmosphères, Milieux, Observations Spatiales (LATMOS) Université Versailles Saint-Quentin (UVSQ)/Alice Le Gall.

Best regards, Orbiter.ch

Star Discovered in Closest Known Orbit Around Likely Black Hole


NASA - Chandra X-ray Observatory patch.

Astronomers have found evidence for a star that whips around a black hole about twice an hour. This may be the tightest orbital dance ever witnessed for a likely black hole and a companion star.


Image above: Artist's illustration of a star found in the closest orbit known around a black hole in the globular cluster named 47 Tucanae. Image Credits: X-ray: NASA/CXC/University of Alberta/A.Bahramian et al.; Illustration: NASA/CXC/M.Weiss.

This discovery was made using NASA’s Chandra X-ray Observatory as well as NASA’s NuSTAR and CSIRO’s Australia Telescope Compact Array (ATCA).

The close-in stellar couple – known as a binary – is located in the globular cluster 47 Tucanae, a dense cluster of stars in our galaxy about 14,800 light years from Earth.

While astronomers have observed this binary for many years, it wasn’t until 2015 that radio observations with the ATCA revealed the pair likely contains a black hole pulling material from a companion star called a white dwarf, a low-mass star that has exhausted most or all of its nuclear fuel.

New Chandra data of this system, known as X9, show that it changes in X-ray brightness in the same manner every 28 minutes, which is likely the length of time it takes the companion star to make one complete orbit around the black hole. Chandra data also shows evidence for large amounts of oxygen in the system, a characteristic feature of white dwarfs. A strong case can, therefore, be made that the companion star is a white dwarf, which would then be orbiting the black hole at only about 2.5 times the separation between the Earth and the Moon.

“This white dwarf is so close to the black hole that material is being pulled away from the star and dumped onto a disk of matter around the black hole before falling in,” said first author Arash Bahramian of the University of Alberta in Edmonton, Canada, and Michigan State University in East Lansing. “Luckily for this star, we don’t think it will follow this path into oblivion, but instead will stay in orbit.”


Although the white dwarf does not appear to be in danger of falling in or being torn apart by the black hole, its fate is uncertain.

Chandra X-ray Observatory. Image Credits: NASA/CXC

“Eventually so much matter may be pulled away from the white dwarf that it ends up only having the mass of a planet,” said co-author Craig Heinke, also of the University of Alberta. “If it keeps losing mass, the white dwarf may completely evaporate.”


How did the black hole get such a close companion? One possibility is that the black hole smashed into a red giant star, and then gas from the outer regions of the star was ejected from the binary. The remaining core of the red giant would form into a white dwarf, which becomes a binary companion to the black hole. The orbit of the binary would then have shrunk as gravitational waves were emitted, until the black hole started pulling material from the white dwarf.

The gravitational waves currently being produced by the binary have a frequency that is too low to be detected with Laser Interferometer Gravitational-Wave Observatory, LIGO, that has recently detected gravitational waves from merging black holes. Sources like X9 could potentially be detected with future gravitational wave observatories in space.

An alternative explanation for the observations is that the white dwarf is partnered with a neutron star, rather than a black hole. In this scenario, the neutron star spins faster as it pulls material from a companion star via a disk, a process that can lead to the neutron star spinning around its axis thousands of times every second. A few such objects, called transitional millisecond pulsars, have been observed near the end of this spinning up phase. The authors do not favor this possibility as transitional millisecond pulsars have properties not seen in X9, such as extreme variability at X-ray and radio wavelengths. However, they cannot disprove this explanation.


“We’re going to watch this binary closely in the future, since we know little about how such an extreme system should behave”, said co-author Vlad Tudor of Curtin University and the International Centre for Radio Astronomy Research in Perth, Australia. “We’re also going to keep studying globular clusters in our galaxy to see if more evidence for very tight black hole binaries can be found.”


A paper describing these results was recently accepted for publication in the Monthly Notices of the Royal Astronomical Society and is available online: https://arxiv.org/abs/1702.02167

NASA's Marshall Space Flight Center in Huntsville, Alabama, manages the Chandra program for NASA's Science Mission Directorate in Washington. The Smithsonian Astrophysical Observatory in Cambridge, Massachusetts, controls Chandra's science and flight operations.

Read More from NASA's Chandra X-ray Observatory: http://chandra.harvard.edu/photo/2017/47tuc/

For more Chandra images, multimedia and related materials, visit: http://www.nasa.gov/chandra

Images (mentioned), Text, Credits: NASA/Lee Mohon/Marshall Space Flight Center/Molly Porter/Chandra X-ray Center/Megan Watzke.

Greetings, Orbiter.ch

The Big One


NASA - Cassini International logo.

March 13, 2017


Mimas' gigantic crater Herschel lies near the moon's limb in this Cassini view.

A big enough impact could potentially break up a moon. Luckily for Mimas, whatever created Herschel was not quite big enough to cause that level of disruption.

When large impacts happen, they deliver tremendous amounts of energy -- sometimes enough to cause global destruction.  Even impacts that are not catastrophic can leave enormous, near-permanent scars on bodies like Mimas (246 miles or 396 kilometers across).

This view looks toward the anti-Saturn hemisphere of Mimas. North on Mimas is up and rotated 32 degrees to the left. The image was taken in visible light with the Cassini spacecraft narrow-angle camera on Nov. 19, 2016.

The view was acquired at a distance of approximately 53,000 miles (85,000 kilometers) from Mimas. Image scale is 1,677 feet (511 meters) per pixel.

The Cassini mission is a cooperative project of NASA, ESA (the European Space Agency) and the Italian Space Agency. The Jet Propulsion Laboratory, a division of the California Institute of Technology in Pasadena, manages the mission for NASA's Science Mission Directorate, Washington. The Cassini orbiter and its two onboard cameras were designed, developed and assembled at JPL. The imaging operations center is based at the Space Science Institute in Boulder, Colorado.

Cassini Spacecraft Animation

The Cassini mission is a cooperative project of NASA, ESA (the European Space Agency) and the Italian Space Agency. The Jet Propulsion Laboratory, a division of the California Institute of Technology in Pasadena, manages the mission for NASA's Science Mission Directorate, Washington. The Cassini orbiter and its two onboard cameras were designed, developed and assembled at JPL. The imaging operations center is based at the Space Science Institute in Boulder, Colorado.

For more information about the Cassini-Huygens mission visit https://saturn.jpl.nasa.gov and http://www.nasa.gov/cassini . The Cassini imaging team homepage is at http://ciclops.org and http://www.esa.int/Our_Activities/Space_Science/Cassini-Huygens

Image, Text, Credits: NASA/Tony Greicius/JPL-Caltech/Space Science Institute/Video: ESA.

Greetings, Orbiter.ch