mercredi 15 mars 2017

Relativistic Electrons Uncovered with NASA’s Van Allen Probes


NASA - Van Allen Probes Mission patch.

March 15, 2017

Earth’s radiation belts, two doughnut-shaped regions of charged particles encircling our planet, were discovered more than 50 years ago, but their behavior is still not completely understood. Now, new observations from NASA’s Van Allen Probes mission show that the fastest, most energetic electrons in the inner radiation belt are not present as much of the time as previously thought. The results are presented in a paper in the Journal of Geophysical Research and show that there typically isn’t as much radiation in the inner belt as previously assumed — good news for spacecraft flying in the region.

Leaky Radiation Belts

Video above: Since their discovery at the dawn of the Space Age, Earth's radiation belts continue to reveal new complex structures and behaviors. This visualization shows how the radiation belts change in response to the injection of electrons from a storm in late June 2015. Red colors indicate higher numbers of electrons. Video Credits: NASA's Goddard Space Flight Center/Tom Bridgman.

Past space missions have not been able to distinguish electrons from high-energy protons in the inner radiation belt. But by using a special instrument, the Magnetic Electron and Ion Spectrometer — MagEIS — on the Van Allen Probes, the scientists could look at the particles separately for the first time. What they found was surprising —there are usually none of these super-fast electrons, known as relativistic electrons, in the inner belt, contrary to what scientists expected.

“We’ve known for a long time that there are these really energetic protons in there, which can contaminate the measurements, but we’ve never had a good way to remove them from the measurements until now,” said Seth Claudepierre, lead author and Van Allen Probes scientist at the Aerospace Corporation in El Segundo, California.

Of the two radiation belts, scientists have long understood the outer belt to be the rowdy one. During intense geomagnetic storms, when charged particles from the sun hurtle across the solar system, the outer radiation belt pulsates dramatically, growing and shrinking in response to the pressure of the solar particles and magnetic field.  Meanwhile, the inner belt maintains a steady position above Earth’s surface. The new results, however, show the composition of the inner belt isn’t as constant as scientists had assumed.

Ordinarily, the inner belt is composed of high-energy protons and low-energy electrons. However, after a very strong geomagnetic storm in June 2015, relativistic electrons were pushed deep into the inner belt.

The findings were visible because of the way MagEIS was designed. The instrument creates its own internal magnetic field, which allows it to sort particles based on their charge and energy. By separating the electrons from the protons, the scientists could understand which particles were contributing to the population of particles in the inner belt.

“When we carefully process the data and remove the contamination, we can see things that we’ve never been able to see before,” said Claudepierre. “These results are totally changing the way we think about the radiation belt at these energies.”

(Click on the image for enlarge)

Image above: During a strong geomagnetic storm, electrons at relativistic energies, which are usually only found in the outer radiation belt, are pushed in close to Earth and populate the inner belt. While the electrons in the slot region quickly decay, the inner belt electrons can remain for many months. Image Credits: NASA’s Goddard Space Flight Center/Mary Pat Hrybyk-Keith.

Given the rarity of the storms, which can inject relativistic electrons into the inner belt, the scientists now understand there to typically be lower levels of radiation there — a result that has implications for spacecraft flying in the region. Knowing exactly how much radiation is present may enable scientists and engineers to design lighter and cheaper satellites tailored to withstand the less intense radiation levels they’ll encounter.

In addition to providing a new outlook on spacecraft design, the findings open a new realm for scientists to study next.

“This opens up the possibility of doing science that previously was not possible,” said Shri Kanekal, Van Allen Probes deputy mission scientist at NASA’s Goddard Space Flight Center in Greenbelt, Maryland, not involved with the study. “For example, we can now investigate under what circumstances these electrons penetrate the inner region and see if more intense geomagnetic storms give electrons that are more intense or more energetic.”

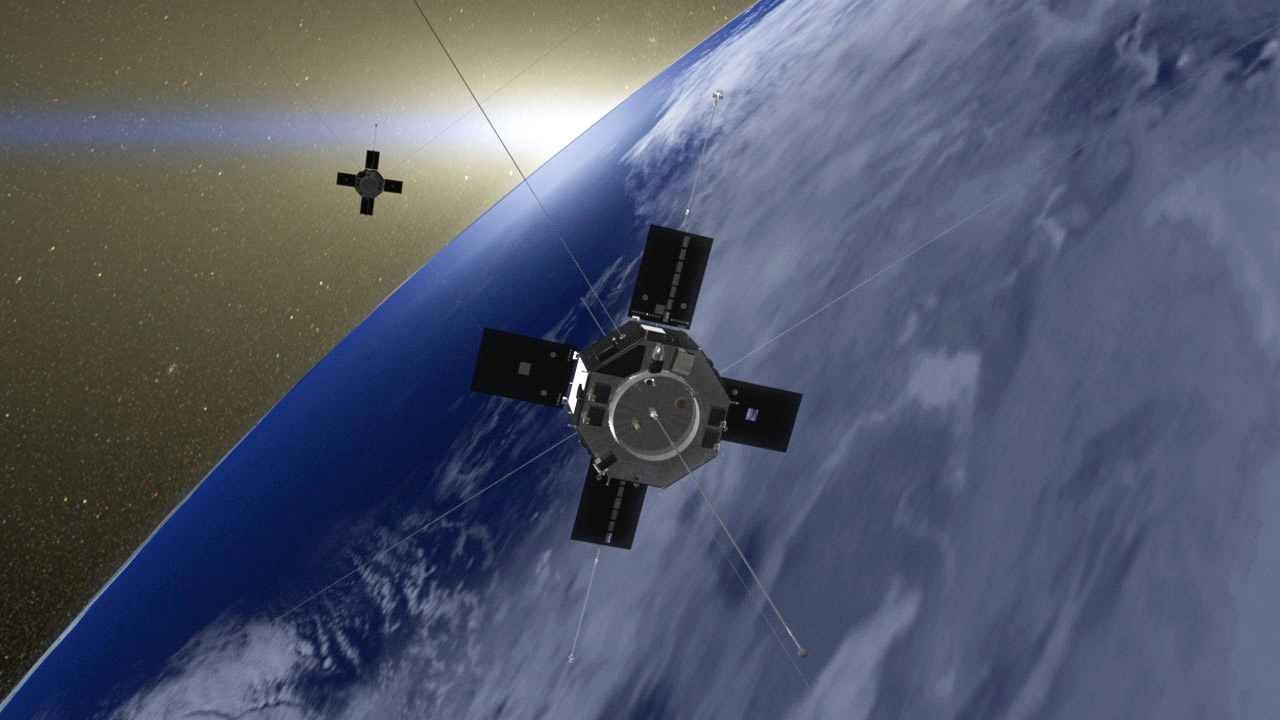
Van Allen Probes in orbit. Image Credit: NASA

The Van Allen Probes is the second mission in NASA’s Living with a Star Program and one of many NASA heliophysics missions studying our near-Earth environment. The spacecraft plunge through the radiation belts five to six times a day on a highly elliptical orbit, in order to understand the physical processes that add and remove electrons from the region.

Related links:

Journal of Geophysical Research: http://onlinelibrary.wiley.com/doi/10.1002/2016JA023719/abstract

NASA's Van Allen Probes website: http://www.nasa.gov/van-allen-probes/

Images (mentioned), Video (mentioned), Text, Credits: NASA's Goddard Space Flight Center, by Mara Johnson-Groh/Rob Garner.

Best regards, Orbiter.ch

Experiments Show Titan Lakes May Fizz with Nitrogen


NASA & ESA - Cassini-Huygens Mission to Saturn & Titan patch.

March 15, 2017

A recent NASA-funded study has shown how the hydrocarbon lakes and seas of Saturn's moon Titan might occasionally erupt with dramatic patches of bubbles.

For the study, researchers at NASA's Jet Propulsion Laboratory in Pasadena, California, simulated the frigid surface conditions on Titan, finding that significant amounts of nitrogen can be dissolved in the extremely cold liquid methane that rains from the skies and collects in rivers, lakes and seas. They demonstrated that slight changes in temperature, air pressure or composition can cause the nitrogen to rapidly separate out of solution, like the fizz that results when opening a bottle of carbonated soda.


Image above: Cassini captured this mosaic of images showing the northern lakes and seas of Saturn's moon Titan on Feb. 17, 2017. The mission's final close Titan flyby is planned for April 22. Image Credits: NASA/JPL-Caltech/Space Science Institute.

NASA's Cassini spacecraft has found that the composition of Titan's lakes and seas varies from place to place, with some reservoirs being richer in ethane than methane. "Our experiments showed that when methane-rich liquids mix with ethane-rich ones -- for example from a heavy rain, or when runoff from a methane river mixes into an ethane-rich lake -- the nitrogen is less able to stay in solution," said Michael Malaska of JPL, who led the study.

The result is bubbles. Lots of bubbles

The release of nitrogen, known as exsolution, can also occur when methane seas warm slightly during the changing seasons on Titan. A fizzy liquid could also cause problems, potentially, for a future robotic probe sent to float on or swim through Titan's seas. Excess heat emanating from a probe might cause bubbles to form around its structures -- for example, propellers used for propulsion -- making it difficult to steer or keep the probe stable.

Cassini Titan flyby. Image Credits: NASA/JPL-Caltech

Magic Island Mechanism?

The notion of nitrogen bubbles creating fizzy patches on Titan's lakes and seas is relevant to one of the more enchanting unsolved mysteries Cassini has investigated during its time exploring Titan: the so-called "magic islands." During several flybys, Cassini's radar has revealed small areas on the seas that appeared and disappeared, and then (in at least one case) reappeared. Researchers proposed several potential explanations for what could be creating these seemingly island-like features, including the idea of fields of bubbles. The new study provides details about the mechanism that could be forming such bubbles, if they are indeed the culprit.


Image above: Radar images from Cassini showed a strange island-like feature in one of Titan's hydrocarbon seas that appeared to change over time (series of images at left). One possible explanation for this "magic island" is bubbles. Image Credits: NASA/JPL-Caltech/Space Science Institute.

"Thanks to this work on nitrogen's solubility, we're now confident that bubbles could indeed form in the seas, and in fact may be more abundant than we'd expected," said Jason Hofgartner of JPL, who serves as a co-investigator on Cassini's radar team and was a co-author of the study.

Freezing Fizz and Breathing Lakes

In characterizing how nitrogen moves between Titan's liquid reservoirs and its atmosphere, the researchers also coaxed nitrogen out of a simulated ethane-rich solution as the ethane froze to the bottom of their tiny, simulated Titan lake. Unlike water, which is less dense in its solid form than its liquid form, ethane ice would form on the bottom of Titan's frigid pools. As the ethane crystalizes into ice, there's no room for the dissolved nitrogen gas, and it comes fizzing out.

Nitrogen Fizzing Out of Ethane Slush

While the thought of hydrocarbon lakes bubbling with nitrogen on an alien moon is dramatic, Malaska points out that the movement of nitrogen on Titan doesn't just move in one direction. Clearly, it has to get into the methane and ethane before it can get out.

"In effect, it's as though the lakes of Titan breathe nitrogen," Malaska said. "As they cool, they can absorb more of the gas, 'inhaling.' And as they warm, the liquid's capacity is reduced, so they 'exhale.'"

A similar phenomenon occurs on Earth with carbon dioxide absorption by our planet's oceans.

Results of the study were published online in February by the journal Icarus.

Final Titan Flyby Nears

Cassini will make its final close flyby of Titan -- its 127th targeted encounter -- on April 22. During the flyby, Cassini will sweep its radar beam over Titan's northern seas one final time. The radar team designed the upcoming observation so that, if magic island features are present this time, their brightness may be useful for distinguishing between bubbles, waves and floating or suspended solids.

The flyby also will bend the spacecraft's course to begin its final series of 22 plunges through the gap between Saturn and its innermost rings, known as Cassini's Grand Finale. The 20-year mission will conclude with a dive into Saturn's atmosphere on Sept. 15.

The Cassini-Huygens mission is a cooperative project of NASA, ESA (European Space Agency) and the Italian Space Agency. NASA's Jet Propulsion Laboratory, a division of Caltech in Pasadena, manages the mission for NASA's Science Mission Directorate, Washington. JPL designed, developed and assembled the Cassini orbiter.

More information about Cassini:

http://www.nasa.gov/cassini

http://saturn.jpl.nasa.gov

http://www.esa.int/Our_Activities/Space_Science/Cassini-Huygens

Images (mentioned), Text, Credits: NASA//JPL/Preston Dyches.

Greetings, Orbiter.ch

GRACE Mission: 15 Years of Watching Water on Earth


NASA - GRACE Mission patch.

March 15, 2017

Fast Facts:

- In 15 years of operations, the GRACE satellite mission has revolutionized our view of how water moves and is stored on Earth.

- GRACE measures changes in the local pull of gravity as water shifts around Earth due to changing seasons, weather and climate processes.

- Among other innovations, GRACE gave us the first space-based view of water beneath Earth's surface, giving insight into where aquifers may be shrinking or dry soils contributing to drought.

- The GRACE Follow-On mission, launching in early 2018, will extend GRACE's innovative measurements.


"Revolutionary" is a word you hear often when people talk about the GRACE mission. Since the twin satellites of the U.S./German Gravity Recovery and Climate Experiment  launched on March 17, 2002, their data have transformed scientists' view of how water moves and is stored around the planet.

"With GRACE, we effectively created a new field of spaceborne remote sensing: tracking the movement of water via its mass," said Michael Watkins, the original GRACE project scientist and now director of NASA's Jet Propulsion Laboratory, Pasadena, California.

Like many other transformations, GRACE began with an insight. "The completely new idea about GRACE was the perception that measuring mass gives you a way to probe the Earth system," said Principal Investigator Byron Tapley, director of the Center for Space Research and professor in the Cockrell School of Engineer at The University of Texas at Austin. Measuring changes in mass has been a key to discovering how water and the solid Earth are changing in places humans can't go or can't see.

15 Years of GRACE Earth Observations

The Weight of Water

The greater an object's mass, the greater its gravitational pull. For example, the massive Rocky Mountains exert more gravitational pull than the flat plains of the Midwest. Humans don't notice the tiny difference, but satellites do. While orbiting Earth, satellites accelerate very slightly as they approach a massive feature, and slow down as they move away.

The vast majority of Earth's gravitational pull is due to the mass of Earth's interior. A small part, however, is due to the mass of water on or near Earth's surface. The ocean, rivers, glaciers and underground water change much more rapidly than Earth's interior does, responding to changing seasons, storms, droughts and other weather and climate effects. GRACE grew from the recognition that a specially designed mission could observe these changes in water from space, revealing hidden secrets of the water cycle.

GRACE measures changes in mass through their effects on twin satellites orbiting one behind the other about 137 miles apart (220 kilometers). The small accelerations and decelerations caused by changing mass below the spacecraft alter the distance between them very slightly -- by a few microns (a fraction of the diameter of a human hair). To measure this ever-changing distance, the spacecraft constantly beam microwave pulses at each other and time the arrival of returning signals. GPS keeps track of where the spacecraft are relative to Earth's surface, and onboard accelerometers record forces on the spacecraft other than gravity, such as atmospheric drag and solar radiation. Scientists process these data to produce monthly maps of regional variations in global gravity, showing how water on or near Earth's surface has moved every month.

When NASA selected this complex, high-precision mission for launch under its Earth System Science Pathfinder program, "A lot of people thought it was a bit improbable that we could actually bring it off," Tapley said. He credits the mission's success to a close collaboration between NASA and two German partners, the Deutsches Zentrum für Luft- und Raumfahrt (DLR, the German Aerospace agency) and the Helmholtz Centre Potsdam German Research Centre for Geosciences (GFZ), with leadership from original co-principal investigator Christoph Reigber and project manager Frank Flechtner of GFZ. The collaboration has run very smoothly, according to Flechtner, who has now taken the role of GRACE's German co-principal investigator. "It's as if we are one family on both sides of the Atlantic."

GRACE was built in Germany at Airbus Defense and Space. DLR procured a Russian "Rockot" as the launch vehicle. GFZ is involved in the U.S./German Science Data System and mission operations at DLR´s German Space Operations Center. GRACE ground segment operations are currently co-funded by GFZ and the European Space Agency (ESA). NASA, ESA, GFZ and DLR are supporting the continuation of the measurements of mass redistribution in the Earth system.

What GRACE Has Taught Us

Here are a few highlights of discoveries from GRACE during its 15 years of operation. These discoveries reflect the work of researchers worldwide, who have developed innovative techniques to use the data and combine it with other observations and models for new insights into the Earth system.

Underground water: Water stored in soil and aquifers below Earth's surface is very sparsely measured worldwide. In describing GRACE's contribution to understanding this life-giving resource, JPL Senior Water Scientist Jay Famiglietti said, "I can't think of another set of measurements that have so revolutionized the science."

Hydrologist Matt Rodell of NASA's Goddard Space Flight Center, Greenbelt, Maryland, did his doctoral research on GRACE's hydrological uses. Rodell said no one guessed before launch that GRACE would reveal unknown groundwater depletion, but over the last decade, he, Famiglietti and other researchers have found more and more locations where humans are pumping out groundwater faster than it is replenished. In 2015, their team published a comprehensive survey showing a third of Earth's largest groundwater basins are being rapidly depleted.

Dry soils can add to drought risk or increase the length of a drought. Rodell and his team provide GRACE data on deep soil moisture and groundwater to the National Drought Mitigation Center each week, using a hydrology model to calculate how the moisture is changing throughout the month between one map and the next. The data are used in preparing weekly maps of U.S. drought risk.

Artist's concept of Grace. Image credits: NASA/JPL

Melting ice sheets: Antarctica is one of the world's toughest places to collect data, and Greenland isn't far behind. Yet we need to know how fast these ice sheets are melting to better understand rates and variations of sea level rise around the world. Scientists studying ice sheets and glaciers were among the first to start working with GRACE data to extract the information they needed. In the mid-2000s, Jianli Chen (University of Texas at Austin); Isabella Velicogna (University of California, Irvine); and the late John Wahr showed that ice losses from Greenland and Antarctica were dramatically larger than previously estimated, using estimates of the changing height of the ice sheets and other types of data. Since GRACE launched, its measurements show Greenland has been losing about 280 gigatons of ice per year on average -- a bit less than twice the weight of Mt. Everest -- and Antarctica has lost slightly under 120 gigatons a year. There are indications that both melt rates are increasing.

Sea level: The sea level is rising both because melting ice from land is flowing into the ocean and because seawater is expanding as it warms. Scientists have a very precise, continuous measurement of sea level heights worldwide beginning in 1992 with the NASA-French Topex-Poseidon mission and continuing through the Jason series of sea level altimetry missions. The altimeter measurements, however, see only the full effect of ocean height changes from all causes -- warming, ice melting and runoff from land. To get an in-depth view of the processes responsible for the changes, scientists need to know how much of the full effect is due to each one.

With GRACE, scientists are able to distinguish between changes in water mass and changes in ocean temperatures. An example of the value of this ability is a study led by GRACE Project Scientist Carmen Boening of JPL, which both documented and explained a significant drop in sea level with the 2011 La Niña event. The study showed that the water that left the ocean, causing the drop in sea level, was rained out over Australia, South America and Asia. The finding gave scientists a new view on the global water cycle.

Solid Earth changes: The viscous mantle under Earth's crust is also moving ever so slightly in response to mass changes from water near the surface. GRACE has a community of users that calculate these shifts for their research. JPL scientists Surendra Adhikari and Erik Ivins recently used GRACE data to calculate how ice sheet loss and groundwater depletion have actually changed the rotation of Earth as the system adjusts to these movements of mass.

GRACE's planners didn't have much hope that the mission's measurement could be used to pinpoint the abrupt changes in mass associated with large earthquakes because of the difference in scale: earthquakes are sudden and local, whereas GRACE's monthly maps average over an area the size of Illinois and an entire month of time. However, by devising new data processing and modeling techniques, researchers have found a way to isolate the earthquake effects. "We're able to measure the instantaneous mass shift in an earthquake, and we've found there's a very measurable relaxation that goes on for one or two months after the earthquake," Tapley said. These measurements provide unprecedented insights into what is happening far below Earth's surface in big quakes such as the 2004 Sumatra event and 2011 Tohuku (Japan) quake, both of which caused devastating tsunamis.

The Future

At 15 years, GRACE has lasted three times as long as originally planned. Project managers have done everything possible to extend its life, but the spacecraft will run out of fuel soon -- probably this summer. NASA and GFZ have been working since 2012 on a second GRACE mission called GRACE Follow-On (GRACE-FO), with Germany again procuring a launch vehicle and the twin satellites built at Airbus in Germany. "With GRACE, we have gained new insight into how global and regional water resources are evolving," said Frank Webb, the GRACE-FO project scientist. "Through GRACE-FO, we will extend into the next decade our capacity to gain an accurate picture of the global water cycle."

GRACE-FO is scheduled for launch between December 2017 and February 2018. The new mission focuses on continuing GRACE's successful data record. The new satellites use similar hardware to GRACE and will also carry a technology demonstrator with a new laser ranging instrument to track the separation distance between the satellites.  The laser instrument has the potential to produce an even more accurate measurement.

"GRACE-FO allows us to continue the revolutionary legacy of GRACE," said JPL's Watkins. "There are sure to be more unexpected and innovative findings ahead."

Related links:

Weekly maps of U.S. drought risk: http://droughtmonitor.unl.edu/

GRACE data on deep soil moisture and groundwater: http://drought.unl.edu/MonitoringTools/NASAGRACEDataAssimilation.aspx

National Drought Mitigation Center: http://drought.unl.edu/

Topex-Poseidon: https://sealevel.jpl.nasa.gov/missions/topex/

GRACE Follow-On (GRACE-FO): https://gracefo.jpl.nasa.gov/

For more information on GRACE:

http://grace.jpl.nasa.gov

http://www.csr.utexas.edu/grace

Images (mentioned), Video, Text, Credits: NASA Earth Science News Team, written by Carol Rasmussen/JPL/Alan Buis/University of Texas/Sandra Zaragoza.

Greetings, Orbiter.ch

Dark Matter Less Influential in Galaxies in Early Universe


ESO - European Southern Observatory logo.

15 March 2017

VLT observations of distant galaxies suggest they were dominated by normal matter

Comparison of rotating disc galaxies in the distant Universe and the present day

New observations indicate that massive, star-forming galaxies during the peak epoch of galaxy formation, 10 billion years ago, were dominated by baryonic or “normal” matter. This is in stark contrast to present-day galaxies, where the effects of mysterious dark matter seem to be much greater. This surprising result was obtained using ESO’s Very Large Telescope and suggests that dark matter was less influential in the early Universe than it is today. The research is presented in four papers, one of which will be published in the journal Nature this week.

We see normal matter as brightly shining stars, glowing gas and clouds of dust. But the more elusive dark matter does not emit, absorb or reflect light and can only be observed via its gravitational effects. The presence of dark matter can explain why the outer parts of nearby spiral galaxies rotate more quickly than would be expected if only the normal matter that we can see directly were present [1].

Comparison of rotating disc galaxies in the distant Universe and the present day

Now, an international team of astronomers led by Reinhard Genzel at the Max Planck Institute for Extraterrestrial Physics in Garching, Germany have used the KMOS and SINFONI instruments at ESO’s Very Large Telescope in Chile [2] to measure the rotation of six massive, star-forming galaxies in the distant Universe, at the peak of galaxy formation 10 billion years ago.

What they found was intriguing: unlike spiral galaxies in the modern Universe, the outer regions of these distant galaxies seem to be rotating more slowly than regions closer to the core — suggesting there is less dark matter present than expected [3].

“Surprisingly, the rotation velocities are not constant, but decrease further out in the galaxies,” comments Reinhard Genzel, lead author of the Nature paper. “There are probably two causes for this. Firstly, most of these early massive galaxies are strongly dominated by normal matter, with dark matter playing a much smaller role than in the Local Universe. Secondly, these early discs were much more turbulent than the spiral galaxies we see in our cosmic neighbourhood.”

Comparison of rotating disc galaxies in the distant Universe and the present day

Both effects seem to become more marked as astronomers look further and further back in time, into the early Universe. This suggests that 3 to 4 billion years after the Big Bang, the gas in galaxies had already efficiently condensed into flat, rotating discs, while the dark matter halos surrounding them were much larger and more spread out. Apparently it took billions of years longer for dark matter to condense as well, so its dominating effect is only seen on the rotation velocities of galaxy discs today.

This explanation is consistent with observations showing that early galaxies were much more gas-rich and compact than today’s galaxies.

The six galaxies mapped in this study were among a larger sample of a hundred distant, star-forming discs imaged with the KMOS and SINFONI instruments at ESO’s Very Large Telescope at the Paranal Observatory in Chile. In addition to the individual galaxy measurements described above, an average rotation curve was created by combining the weaker signals from the other galaxies. This composite curve also showed the same decreasing velocity trend away from the centres of the galaxies. In addition, two further studies of 240 star forming discs also support these findings.

Comparison of rotating disc galaxies in the distant Universe and the present day

Detailed modelling shows that while normal matter typically accounts for about half of the total mass of all galaxies on average, it completely dominates the dynamics of galaxies at the highest redshifts.

Notes:

[1] The disc of a spiral galaxy rotates over a timescale of hundreds of millions of years. Spiral galaxy cores have high concentrations of stars, but the density of bright matter decreases towards their outskirts. If a galaxy’s mass consisted entirely of normal matter, then the sparser outer regions should rotate more slowly than the dense regions at the centre. But observations of nearby spiral galaxies show that their inner and outer parts actually rotate at approximately the same speed. These “flat rotation curves ” indicate that spiral galaxies must contain large amounts of non-luminous matter in a dark matter halo surrounding the galactic disc.

[2] The data analysed were obtained with the integral field spectrometers KMOS and SINFONI at ESO’s Very Large Telescope in Chile in the framework of the KMOS3D and SINS/zC-SINF surveys. It is the first time that such a comprehensive study of the dynamics of a large number of galaxies spanning the redshift interval from z~0.6 to 2.6, or 5 billion years of cosmic time, has been carried out.

[3] This new result does not call into question the need for dark matter as a fundamental component of the Universe or the total amount. Rather it suggests that dark matter was differently distributed in and around disc galaxies at early times compared to the present day.

More information:

This research was presented in a paper entitled “Strongly baryon dominated disk galaxies at the peak of galaxy formation ten billion years ago”, by R. Genzel et al., to appear in the journal Nature.

The team is composed of R. Genzel (Max-Planck-Institut für extraterrestrische Physik, Garching, Germany; University of California, Berkeley, USA), N.M. Förster Schreiber (Max-Planck-Institut für extraterrestrische Physik, Garching, Germany), H. Übler (Max-Planck-Institut für extraterrestrische Physik, Garching, Germany), P. Lang (Max-Planck-Institut für extraterrestrische Physik, Garching, Germany), T. Naab (Max-Planck-Institut für Astrophysik, Garching, Germany), R. Bender (Universitäts-Sternwarte Ludwig-Maximilians-Universität, München, Germany; Max-Planck-Institut für extraterrestrische Physik, Garching, Germany), L.J. Tacconi (Max-Planck-Institut für extraterrestrische Physik, Garching, Germany), E. Wisnioski (Max-Planck-Institut für extraterrestrische Physik, Garching, Germany), S.Wuyts (Max-Planck-Institut für extraterrestrische Physik, Garching, Germany; University of Bath, Bath, UK), T. Alexander (The Weizmann Institute of Science, Rehovot, Israel), A. Beifiori (Universitäts-Sternwarte Ludwig-Maximilians-Universität, München, Germany; Max-Planck-Institut für extraterrestrische Physik, Garching, Germany), S.Belli (Max-Planck-Institut für extraterrestrische Physik, Garching, Germany), G. Brammer (Space Telescope Science Institute, Baltimore, USA), A.Burkert (Max-Planck-Institut für Astrophysik, Garching, Germany; Max-Planck-Institut für extraterrestrische Physik, Garching, Germany) C.M. Carollo (Eidgenössische Technische Hochschule, Zürich, Switzerland), J. Chan (Max-Planck-Institut für extraterrestrische Physik, Garching, Germany), R. Davies (Max-Planck-Institut für extraterrestrische Physik, Garching, Germany), M. Fossati (Max-Planck-Institut für extraterrestrische Physik, Garching, Germany; Universitäts-Sternwarte Ludwig-Maximilians-Universität, München, Germany), A. Galametz (Max-Planck-Institut für extraterrestrische Physik, Garching, Germany; Universitäts-Sternwarte Ludwig-Maximilians-Universität, München, Germany), S. Genel (Center for Computational Astrophysics, New York, USA), O. Gerhard (Max-Planck-Institut für extraterrestrische Physik, Garching, Germany), D. Lutz (Max-Planck-Institut für extraterrestrische Physik, Garching, Germany), J.T. Mendel (Max-Planck-Institut für extraterrestrische Physik, Garching, Germany; Universitäts-Sternwarte Ludwig-Maximilians-Universität, München, Germany), I. Momcheva (Yale University, New Haven, USA), E.J. Nelson (Max-Planck-Institut für extraterrestrische Physik, Garching, Germany; Yale University, New Haven, USA), A. Renzini (Vicolo dell'Osservatorio 5, Padova, Italy), R.Saglia (Max-Planck-Institut für extraterrestrische Physik, Garching, Germany; Universitäts-Sternwarte Ludwig-Maximilians-Universität, München, Germany), A. Sternberg (Tel Aviv University, Tel Aviv, Israel), S. Tacchella (Eidgenössische Technische Hochschule, Zürich, Switzerland), K.Tadaki (Max-Planck-Institut für extraterrestrische Physik, Garching, Germany) and D. Wilman (Universitäts-Sternwarte Ludwig-Maximilians-Universität, München, Germany; Max-Planck-Institut für extraterrestrische Physik, Garching, Germany).

ESO is the foremost intergovernmental astronomy organisation in Europe and the world’s most productive ground-based astronomical observatory by far. It is supported by 16 countries: Austria, Belgium, Brazil, the Czech Republic, Denmark, France, Finland, Germany, Italy, the Netherlands, Poland, Portugal, Spain, Sweden, Switzerland and the United Kingdom, along with the host state of Chile. ESO carries out an ambitious programme focused on the design, construction and operation of powerful ground-based observing facilities enabling astronomers to make important scientific discoveries. ESO also plays a leading role in promoting and organising cooperation in astronomical research. ESO operates three unique world-class observing sites in Chile: La Silla, Paranal and Chajnantor. At Paranal, ESO operates the Very Large Telescope, the world’s most advanced visible-light astronomical observatory and two survey telescopes. VISTA works in the infrared and is the world’s largest survey telescope and the VLT Survey Telescope is the largest telescope designed to exclusively survey the skies in visible light. ESO is a major partner in ALMA, the largest astronomical project in existence. And on Cerro Armazones, close to Paranal, ESO is building the 39-metre European Extremely Large Telescope, the E-ELT, which will become “the world’s biggest eye on the sky”.

Links:

ESOcast 100 Light: Dark Matter Less Influential in Early Universe (4K UHD): http://www.eso.org/public/videos/eso1709a/

Research Paper 1 (Genzel et al., in Nature): http://www.eso.org/public/archives/releases/sciencepapers/eso1709/eso1709a.pdf

Research Paper 2: http://www.eso.org/public/archives/releases/sciencepapers/eso1709/eso1709b.pdf

Research Paper 3: http://www.eso.org/public/archives/releases/sciencepapers/eso1709/eso1709c.pdf

Research Paper 4: http://www.eso.org/public/archives/releases/sciencepapers/eso1709/eso1709d.pdf

Photos of the VLT: http://www.eso.org/public/images/archive/category/paranal/

ESO’s Very Large Telescope (VLT): http://www.eso.org/public/teles-instr/paranal-observatory/vlt/

KMOS: http://www.eso.org/public/teles-instr/paranal-observatory/vlt/vlt-instr/kmos/

SINFONI: http://www.eso.org/public/teles-instr/paranal-observatory/vlt/vlt-instr/sinfoni/

Max Planck Institute for Extraterrestrial Physics: http://www.mpe.mpg.de/2169/en

Images, Videos, Text, Credits: ESO/Richard Hook/Max-Planck-Institut für extraterrestrische Physik/Reinhard Genzel/Natascha M. Forster Schreiber/L. Calçada.

Best regards, Orbiter.ch

A ‘toast’ to Copernicus Sentinel-2B as it delivers its first images


ESA - Sentinel-2 logo.

March 15, 2017

Sentinel-2

Just over a week after being lofted into orbit, the European Union’s Sentinel-2B satellite delivered its first images of Earth, offering a glimpse of the ‘colour vision’ it will provide for the Copernicus environmental monitoring programme.

With a swath width of 290 km, the satellite’s first acquisition began over the Baltic Sea and made a strip-like observation through eastern Europe, ending in northern Libya.

 Brindisi, Italy

The data were relayed in real time to the Matera ground station in Italy, where the images were then processed.

While eastern Europe was mostly cloudy, Italy’s sunny skies allowed the teams to get their first glimpse of the multispectral instrument’s capabilities over southern Italy’s Calabria and Apulia regions, the latter often referred to as the ‘heel of the boot’.

One of more distinctive features of this first acquisition is Apulia’s port city of Brindisi – appropriately the same word for the ‘toast’ ritual in Italian. Other areas captured in the first pass include the town of Crotone in Calabria and part of Albania's coast.

The multispectral imager is being calibrated during the commissioning phase – which will take about three months.

Crotone, Italy

Sentinel-2B is the second in the two-satellite mission for Europe’s Copernicus programme. Its twin Sentinel-2A was launched in June 2015. Now that both are in orbit, Sentinel-2 provides repeat coverage every five days.

In addition to demonstrating the high resolution of 10 m per pixel, these initial data foreshadow the mission’s land-monitoring applications in areas such as agriculture, coastal waters and land-cover mapping.

“Sentinel-2B will be one of the workhorses of Copernicus, as it will enable a whole range of applications with a focus on land,” said Josef Aschbacher, Director of ESA’s Earth Observation Programmes.

“With the second Sentinel-2 satellite in orbit, we now have much better coverage – which is especially important for monitoring areas frequently covered by clouds.

“This will further improve data availability of the Copernicus Services and increase the usage of the Copernicus data.”

Karavasta Lagoon, Albania

“The Copernicus Services in the areas of land and coastal monitoring rely on Sentinel-2 data,” said Philippe Brunet, Director for Space Policy, Copernicus and Defence at the European Commission.

“With the launch of the B-unit, the quality of the data products will increase and Copernicus can better manage and protect the environment and natural resources, as well as improve civil security.

Six families of Sentinel satellites will make up the core of EU’s Copernicus environmental monitoring network. An EU flagship space initiative, Copernicus provides operational information on the world’s land surfaces, oceans and atmosphere to support environmental and security policymaking, and meet the needs of citizens and service providers.

Related links:

Copernicus: http://www.esa.int/Our_Activities/Observing_the_Earth/Copernicus

Sentinel-2: http://www.esa.int/Our_Activities/Observing_the_Earth/Copernicus/Sentinel-2

Sentinel data access & technical information: https://sentinels.copernicus.eu/web/sentinel/home

European Commission Copernicus site: http://www.copernicus.eu/

Airbus Defence and Space: http://airbusdefenceandspace.com/

Images, Text, Credits: ESA/contains modified Copernicus Sentinel data (2017), processed by ESA.

Best regards, Orbiter.ch

mardi 14 mars 2017

Here’s what open-heart surgery at the LHC looks like


CERN - European Organization for Nuclear Research logo.

March 14, 2017


Image above: Preparations being made in the underground experimental cavern of CMS prior to the installation of the second-generation Pixel Tracker of CMS. Image Credit: CERN.

Scientists at CERN have now completed “open-heart surgery” on one of the detectors at the Large Hadron Collider (LHC). In a complex operation that ran from 27 February to 9 March, the giant Compact Muon Solenoid (CMS) detector received a new “heart” – it’s Pixel Tracker.


Image above: The FPIX disks were manufactured by 19 institutes in the US. They can be seen here at the CMS Tracker Integration Facility at Meyrin, Switzerland before being taken to the CMS experimental site outside Cessy, France for installation. The Pixel Tracker’s various components were stored and tested carefully on the surface in a clean room prior to installation. (Image: Maximilien Brice/CERN).

Detectors at the LHC, such as CMS, record the signatures of particles produced when beams of protons (or, occasionally, lead nuclei) are smashed together. The detectors are built around the LHC’s beam pipe, within which the collisions take place. As the particles fly through the detectors, they traverse several layers of equipment that are tasked with making specific measurements about their properties. But, when these collisions occur, it isn’t a single proton hitting another proton: several dozen simultaneous collisions take place within CMS. This phenomenon is known as “pile-up” and can be thought of as exposing a film camera to multiple images and recording all the multiple exposures in a single photograph.


Image above: To be installed within CMS, the various components of the Pixel Tracker had to be lowered by crane down the 100-metre-deep shaft into the underground experimental cavern of CMS. They were then raised by a second crane onto the installation platform for insertion. This image shows the first half of the BPIX located inside its “cassette” being placed on this platform before being inserted into the CMS detector. The BPIX, manufactured by 23 institutes from eight European countries, is only the size of a shoebox, but has a large number of electronics and cooling components that go with it. (Image: Maximilien Brice/CERN).

The tracking system determines the trajectories of charged particles flying through it, and identifies the charge and momenta of the particles, helping to determine the origins of the various particles seen by CMS. Physicists can thus separate the overlapping collisions into individual interactions.


Image above: Once lowered onto the installation platform, the protective coverings of the device was removed and it was slowly and carefully slid into place around the LHC beam pipe. Here, the second half of BPIX is being prepared for insertion. (Image: Maximilien Brice/CERN).

The CMS tracking system is made of silicon sensors and has two components that perform a complementary roles: the inner of the two is called the Pixel Tracker and the outer one is the Strip Tracker. The Pixel Tracker sees the greatest onslaught of particles flying through CMS and, unavoidably, it will lose its ability to measure the particles’ properties accurately. In addition, the LHC continues to improve its performance and is expected to provide CMS with an even greater number of simultaneous interactions: even more exposures on each photograph. It had therefore been planned around five years ago to replace the original Pixel Tracker of CMS, removed earlier this year, with an entirely new one.


Image above: The LHC beam pipe can be seen prominently in this picture with the two halves of BPIX fitting snugly around it. The particle beams of the LHC fly within this beam pipe before colliding with each other inside CMS. 6. (Image: Maximilien Brice/CERN).

The new Pixel Tracker has four layers instead of the previous three in the central region (called BPIX for Barrel PIXel) and has three disks instead of the previous two capping each end (called FPIX for Forward PIXel). These additional layers raise the number of silicon pixels in CMS from 66 million to 124 million, increasing the “resolution” of the “photographs” CMS takes, so to speak.


Image above: Surgery in action! Appropriate protection during installation of the FPIX prevents contamination of the device. (Image: Maximilien Brice/CERN)).


Image above: The many wires and electronics connected to the Pixel Tracker’s active components had to be thoroughly checked during the installation procedure and had to be moved into place delicately. (Image: Maximilien Brice/CERN).


Image above: The installation of the final FPIX component brings the long operation of replacing the CMS Pixel Tracker to a successful end. CMS will soon be moved into its data-taking configuration to prepare for the first proton-proton collisions of 2017, expected in early June. (Image: Maximilien Brice/CERN).

Related article:

Open-heart surgery for CMS
http://orbiterchspacenews.blogspot.ch/2017/03/open-heart-surgery-for-cms.html

Note:

CERN, the European Organization for Nuclear Research, is one of the world’s largest and most respected centres for scientific research. Its business is fundamental physics, finding out what the Universe is made of and how it works. At CERN, the world’s largest and most complex scientific instruments are used to study the basic constituents of matter — the fundamental particles. By studying what happens when these particles collide, physicists learn about the laws of Nature.

The instruments used at CERN are particle accelerators and detectors. Accelerators boost beams of particles to high energies before they are made to collide with each other or with stationary targets. Detectors observe and record the results of these collisions.

Founded in 1954, the CERN Laboratory sits astride the Franco–Swiss border near Geneva. It was one of Europe’s first joint ventures and now has 22 Member States.

Related links:

Compact Muon Solenoid (CMS): http://home.cern/about/experiments/cms

Large Hadron Collider (LHC): http://home.cern/topics/large-hadron-collider

For more information about European Organization for Nuclear Research (CERN), Visit: http://home.cern/

Images (mentioned), Text, Credits: CERN/Achintya Rao.

Best regards, Orbiter.ch

Mutants in Microgravity


ISS - International Space Station patch.

March 14, 2017


Image above: Dr. Anita Goel, chairman and scientific director of Nanobiosym in Cambridge, Massachusetts, speaks about the Nanobiosym Genes experiment ahead of its launch aboard SpaceX-10. Image Credits: NASA/Frankie Martin.

Bacteria may mutate more rapidly in space and scientists theorize patterns of those mutations could help predict how pathogens become resistant to antibiotics. Such predictions could, in turn, be used to develop new drugs to use against those pathogens. Antibiotic resistant pathogens or bacteria is a growing world-wide health concern. The long-term use of many common antibiotics has led to some diseases becoming resistant to drug therapy, which can lead to longer and more complicated illnesses.

A proof-of-concept investigation, Nanobiosym Genes, is sending two strains of Staphylococcus aureus bacteria to the International Space Station. Investigators will compare patterns of their mutations to the same organisms grown on Earth in order to refine computational algorithms that predict mutations leading to antibiotic resistance.


Image above: The Nanobiosym Gene Radar®, winner of the first ever XPRIZE awarded for health care. Image Credit: Nanobiosym.

BioServe Space Technologies at the University of Colorado, Boulder integrated this investigation, which is hosted in four BioCells Habitats and BioServe’s Space Automated Bioproduct Lab (SABL).

“More than 25 years ago, I had the hypothesis that environment has an effect on how genes mutate and evolve, or express themselves,” principal investigator Anita Goel, chairman and scientific director at Nanobiosym Inc in Cambridge, Massachusetts, said. Goel holds a doctorate of philosophy in physics and a doctor of medicine degree. “This investigation allows me to study whether we can make mutations happen by changing the environment. The first step is to understand, everything else being the same, how does microgravity affect the rate and the pattern of mutations? Some data suggest that microgravity speeds up mutations, but we don’t know the mechanism of how the environment might play a role.”

Data from the investigation can define the mutational spectrum. Combining that with algorithms can improve the ability to predict mutations, including those that lead to drug resistance.


Image above: The Space Automated Bioproduct Laboratory (SABL) facility. Image Credit: Bioserve.

“We can model which way drug resistance will go and use that to develop better, smarter drugs,” Goel said. “A bug can mutate in the presence of a drug and become resistant. We’re trying to get ahead of that, predict those mutations, and be ready with a drug when they show up.”

While this work is starting with infectious diseases, it can potentially be used with anything that has a DNA marker, including cancer.

There are two key steps: first, a tool that analyzes DNA or RNA, and second, algorithms to determine the right therapy for the particular disease. Goel’s company, Nanobiosym, has developed a device called Gene-RADAR that conducts the first step.

CASIS SpaceX CRS-10: Nanobiosym Payload Overview

“In principle, we can provide real-time diagnosis of any disease with an RNA or DNA signature or genetic fingerprint,” she said. “Ultimately, we can build tools to decentralize health care delivery on Earth, to diagnose diseases in real time in a village in Africa or your own home, just with a drop of blood or saliva. Right now those tests can take weeks to months. The device fits in your hand, so we also can put it on the space station to do analysis and research.”

That real-time analysis has important applications in space. Currently, experiments aboard the space station are brought back to Earth for gene analysis. The device could conduct some analyses in space and send only the data back to Earth. Astronauts could immediately test for DNA life forms in samples collected on Mars, for example, or diagnosis their own infections.

Mutant pathogens in space hardly stand a chance.

Related links:

BioServe: http://www.colorado.edu/engineering/BioServe/

Space Station Research and Technology: https://www.nasa.gov/mission_pages/station/research/index.html

International Space Station (ISS): https://www.nasa.gov/mission_pages/station/main/index.html

Images (mentioned), Text, Credits: NASA Johnson Space Center/Melissa Gaskill/Kristine Rainey/Video: Center for the Advancement of Science In Space (CASIS).

Best regards, Orbiter.ch