

ESA - Sentinel-5P Mission logo.
12 March 2019
New maps that use information from the Copernicus Sentinel-5P satellite reveal nitrogen dioxide emission being released into the atmosphere in cities and towns across the globe.

Nitrogen dioxide worldwide
Air pollution is a global environmental health problem that is responsible for millions of people dying prematurely every year. With air quality a serious concern, the Copernicus Sentinel-5P satellite was launched in October 2017 to map a multitude of air pollutants around the globe.
The satellite carries the most advanced sensor of its type to date: Tropomi. This state-of-the-art instrument detects the unique fingerprint of atmospheric gases to image air pollutants more accurately and at a higher spatial resolution than ever before.

Nitrogen dioxide over Europe
“The European Commission is extremely satisfied with the performance of its satellite,” says Mauro Facchini from the European Commission. “It is a major step forward for Copernicus and European Union’s capacity to monitor air quality.”
It has already delivered key information on sulphur dioxide and carbon monoxide, for example. Now measurements gathered between April and September 2018 have been averaged to show exactly where nitrogen dioxide is polluting the air.
This kind of pollution results from traffic and the combustion of fossil fuel in industrial processes. It can cause significant health issues by irritating the lungs and can contribute to respiratory problems.
Henk Eskes, from the Royal Netherlands Meteorological Institute (KNMI), comments, “The map shows emissions from major cities, but also medium-size towns. With Copernicus Sentinel-5P’s Tropomi instrument, we can observe pollution from individual power plants and other industrial complexes, major highways, and we can identify many more ship tracks than we could before.

Nitrogen dioxide levels over the Middle East
“The Tropomi instrument has a spatial resolution of 3.5 x 7 km, compared to the resolution of 24 × 13 km we had from the Ozone Monitoring Instrument on NASA’s Aura mission. Tropomi is basically ten times better.
“This is very valuable in improving our knowledge on how different sectors contribute to the overall emission of nitrogen oxides.”

Sentinel-5P
Claus Zehner, ESA’s Copernicus Sentinel-5P mission manager, added, “Although we are not thrilled to see all this pollution, we are very happy to see that the satellite is delivering on its promise.
“The spatial resolution really sets the mission apart, which is exactly what is needed to monitor air pollution and understand where it is coming from.”

Nitrogen dioxide levels over China and Japan
Vincent–Henri Peuch from the European Centre for Medium-Range Weather Forecasts (ECMWF) says, “The Copernicus Atmosphere Monitoring Service, known as CAMS, and operated by ECMWF on behalf of the European Union, is monitoring these nitrogen dioxide data in its daily operations.
“Current data assimilation tests show a positive impact on the air-quality forecasts, and we expect to upgrade from monitoring to operational assimilation in the coming months.”
CAMS senior scientist, Antje Inness, added, “CAMS is indeed testing the use of the nitrogen dioxide data in its global forecasting system and hopes to operationally implement this later this year.”
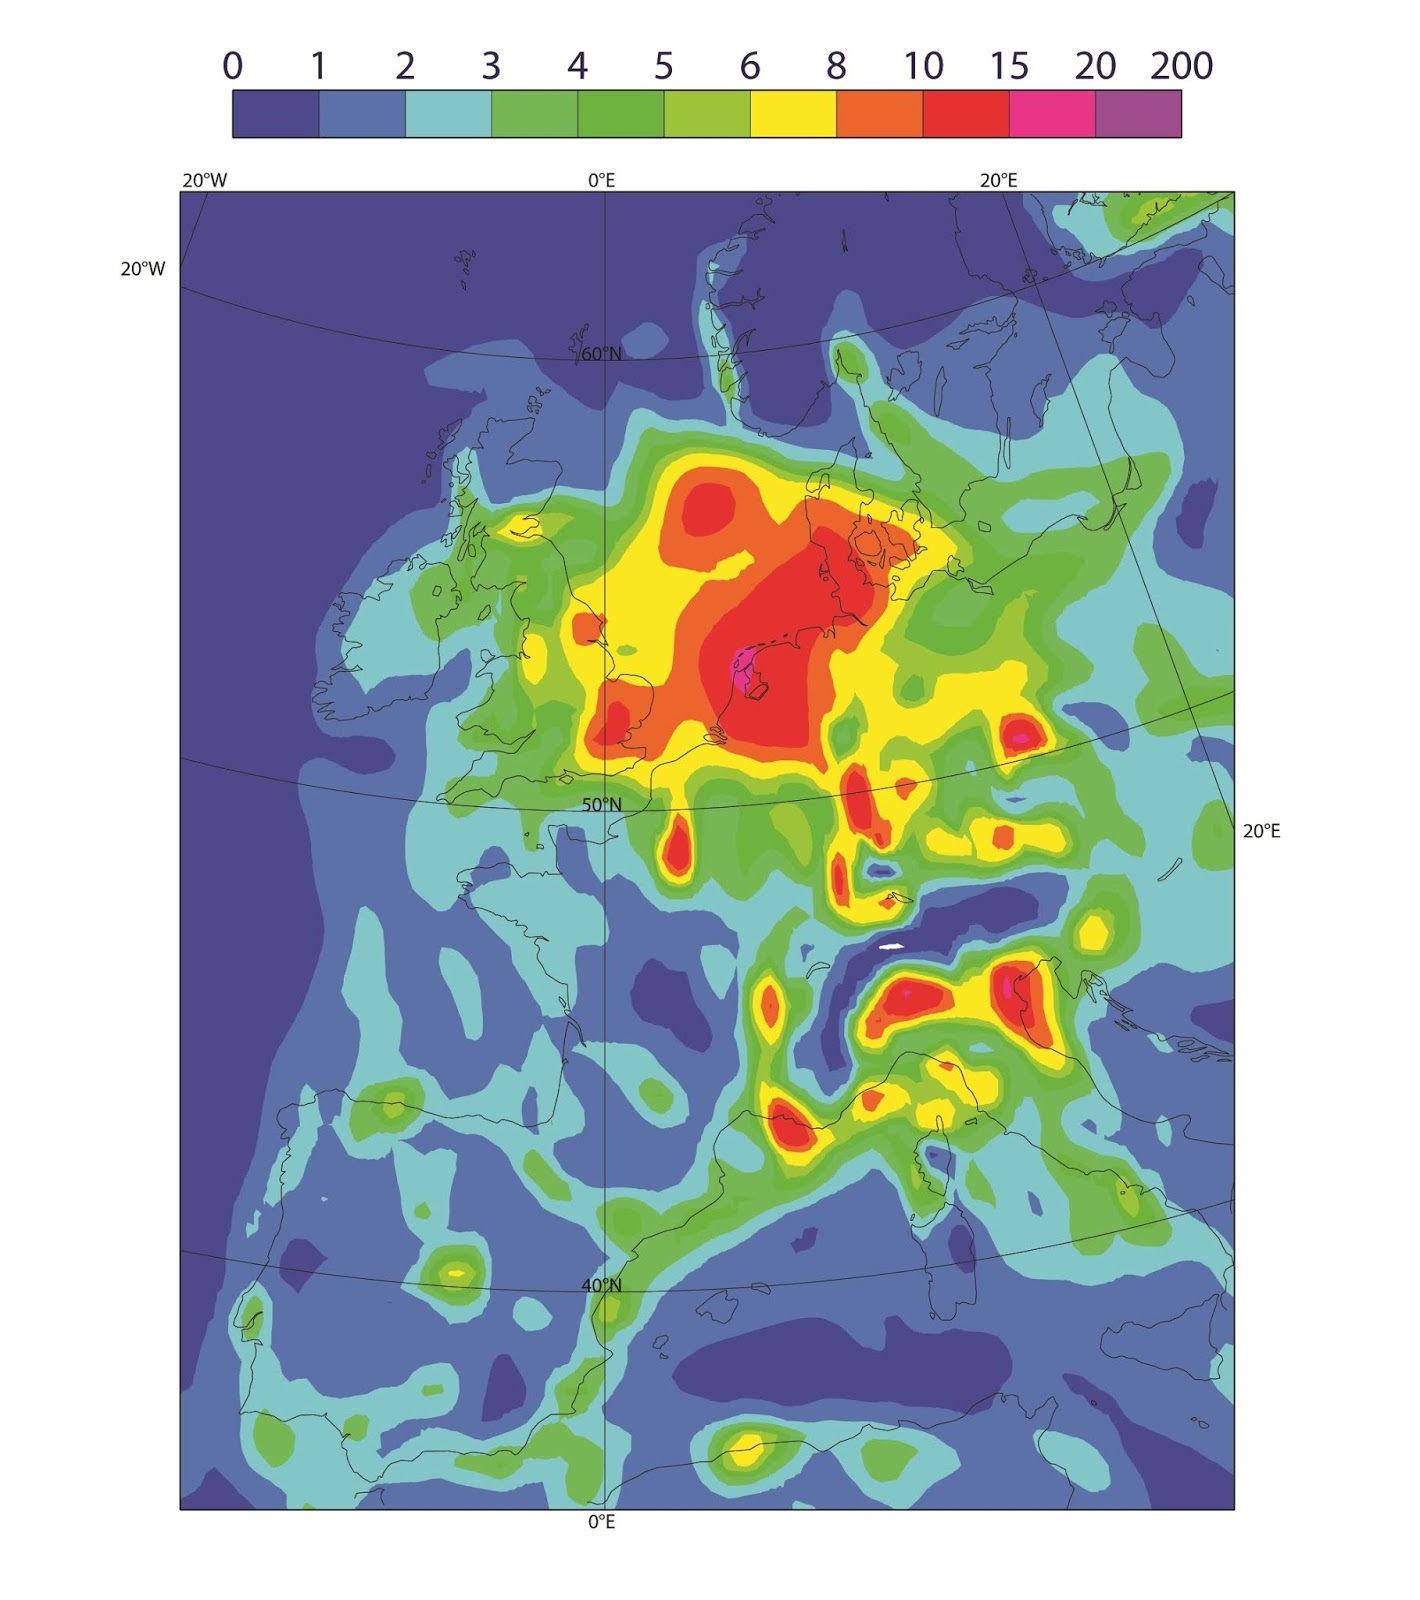
Tropospheric column nitrogen dioxide over Europe
“The Tropomi data show amazing details, but the combination of forecast models and satellite observations within CAMS adds extra value.
“While Tropomi provides incredible views of pollution hot spots from above, the CAMS global and European forecast models translate this information into concentrations of nitrogen dioxide and other pollutants at ground level. CAMs then forecasts the values for the next four to five days.”
Related links:
Sentinel-5P: http://www.esa.int/Our_Activities/Observing_the_Earth/Copernicus/Sentinel-5P
Copernicus Atmosphere Monitoring Service: https://atmosphere.copernicus.eu/
ECMWF: https://www.ecmwf.int/
Netherlands Space Office: http://www.spaceoffice.nl/en/
DLR: http://www.dlr.de/dlr/en/desktopdefault.aspx/tabid-10002/
NASA Aura–OMI: https://aura.gsfc.nasa.gov/omi.html
Images, Text, Credits: ESA/Contains modified Copernicus data (2018), processed by KNMI.
Greetings, Orbiter.ch