

ESA - European Space Agency patch.
6 July 2019
Heatwave conditions catapulted Greenland into an early Arctic summer in June, prompting widespread melting across its icesheet surface, according to researchers at the Danish Meteorological Institute.
Although unusually early, this weather-related event is not unprecedented, according to climate scientist Dr Ruth Mottram, who has published a comprehensive assessment that details major longer-term changes occurring across the planet’s second largest icesheet, in the journal Remote Sensing.
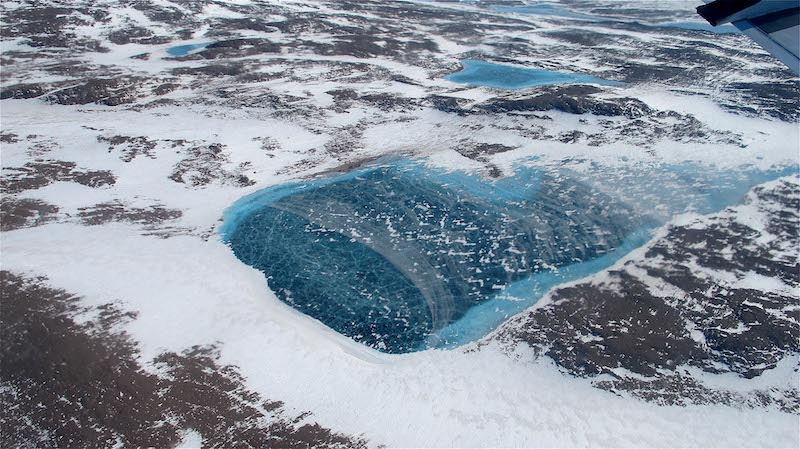
Meltwater lake
The research, involving scientists from DMI, the Technical University of Denmark and the Geological Survey of Denmark and Greenland, combined 30 years of satellite observations of the icesheet’s surface height, mass and movement with climate model output. Collectively this work provides a ‘health check on the icesheets current status and helps to establish the extent of ice loss due to surface melt or from other ocean processes, such as iceberg calving.
An average 255 gigatonnes of ice was lost each year from 2003 to 2016, according to the research team’s findings.
Worringly, the loss of ice shows a marked three-fold acceleration (83 Gt) compared to the preceding decade and consistent with similar studies at the North and South poles, and a potential concern for the international community.
Loss of land ice is a potential indicator of climate change and contributes directly to sea level rise, posing a risk to people living near the coast across the world.
“The Greenland losses have raised sea level by around half a millimeter each year over the observed period,” explains Dr Mottram. She also emphasises the importance of continuing monitoring as scientists are still yet to fully understand the reasons for interannual variability that they observe.

Changing Greenland icesheet height 1995-2017
Almost all of the ice loss was due to changes in surface mass budget, with thinning found virtually everywhere. At some locations, the icesheet surface decreased by over two and a half metres per year between 1995 and 2017 based on measurements using space-borne radar altimeters.
The researchers point to increased melting and changes in snowfall rates for the decrease.
“If an icesheet is to maintain its mass balance, or volume, we would expect to see the height increase at its centre due to snow accumulation. It is striking how this pattern has changed when comparing the early 1990s to the last few years,” explains Dr Mottram.
The rate of ice flow and iceberg calving of glaciers can also be measured from Space, with the study finding that all but one from a representative sample of 28 Greenland glaciers had substantially retreated since the 1990s.
Such changes were found in areas around Jakobshavn Isbrae in western Greenland and Helheim glacier in south east Greenland with the increase in ice flow pulling more ice out of the interior, contributing to a thinning of the icesheet.
The observational datasets used in this study have been developed through the European Space Agency’s Climate Change Initiative. Covering 21 key components of the Earth climate system, including information on the cryosphere and the Greenland icesheet, the continuous and long-term time series are generated by merging historic satellite missions with today’s current satellites, including the Copernicus Sentinels. Referred to as Essential Climate Variables, they provide the empirical evidence of a changing climate and support policy and decision-makers to address the consequences.

Ice velocity maps of Greenland
This latest study used these observations to validate and identify improvements to the existing climate and icesheet computer models, used to simulate the icesheet’s current state and predict how it may change into the future.
Despite huge strides being made in understanding the icesheet, the models and observations did not fully agree in certain areas, such as Southern Greenland, nor were the simulations able to fully capture the variability in year to year ice loss.
The authors emphasise the importance of continuing accurate monitoring of the icesheet to help investigate and model its dynamic processes and point to the Copernicus Sentinel satellites as game-changers.
“With Copernicus Sentinel-1 and -3, we are moving from only being able to take a short snapshot of icesheet flow speeds or calving front changes beginning to be able to monitor the Greenland icesheet remotely, in almost real time.
“We now get consistent, weekly repeat, and with such a richness of data we can more accurately understand how Greenland is responding to a changing environment.”
Related links:
Remote Sensing: https://www.mdpi.com/2072-4292/11/12/1407
Observing the Earth: http://www.esa.int/Our_Activities/Observing_the_Earth
Space for our climate: http://www.esa.int/Our_Activities/Observing_the_Earth/Space_for_our_climate
Climate Change Initiative: http://cci.esa.int/
Sentinel-1: http://www.esa.int/Our_Activities/Observing_the_Earth/Copernicus/Sentinel-1
Sentinel-3: http://www.esa.int/Our_Activities/Observing_the_Earth/Copernicus/Sentinel-3
Copernicus: http://www.esa.int/Our_Activities/Observing_the_Earth/Copernicus
Images, Text, Credits: ESA/Nasa/Jim Yungel/Mottram et al.
Greetings, Orbiter.ch