jeudi 24 mars 2022

Perseverance rover seen by Tianwen-1 orbiter


CNSA - Tianwen-1 (天問-1) Mission to Mars logo.


March 24, 2022

Perseverance rover seen by Tianwen-1 orbiter

According to the China National Space Administration (CNSA), the Zhurong rover and the Tianwen-1 orbiter are currently operating normally.

Perseverance rover seen by Tianwen-1 orbiter

The Tianwen-1 (天问一号) orbiter has been in orbit for 609 days, while the Zhurong (祝融) rover has been working on the surface of Mars for 306 Martian days, traveling a total of 1784 meters.

Tianwen-1 orbiter

Both have captured dust storms on Mars and their effects. On 7 March 2022, the Tianwen-1 orbiter imaged NASA’s Perseverance rover, working in the Jezero crater.

Related articles:

CNSA - Tianwen-1 orbiter deploys “selfie stick”
https://orbiterchspacenews.blogspot.com/2022/01/cnsa-tianwen-1-orbiter-deploys-selfie.html

New images from Tianwen-1 and Zhurong
https://orbiterchspacenews.blogspot.com/2022/01/new-images-from-tianwen-1-and-zhurong.html

China’s Mars rover has amassed reams of novel geological data
https://orbiterchspacenews.blogspot.com/2021/11/chinas-mars-rover-has-amassed-reams-of.html

Tianwen-1 orbiter enters into its science orbit
https://orbiterchspacenews.blogspot.com/2021/11/tianwen-1-orbiter-enters-into-its.html

Zhurong's first weather report from Mars & Tianwen-1 orbiter delays move into science orbit
https://orbiterchspacenews.blogspot.com/2021/08/zhurongs-first-weather-report-from-mars.html

Zhurong completes its designed mission
https://orbiterchspacenews.blogspot.com/2021/08/zhurong-completes-its-designed-mission.html

Tianwen-1 and Zhurong – a new phase of Mars exploration
https://orbiterchspacenews.blogspot.com/2021/08/tianwen-1-and-zhurong-new-phase-of-mars.html

Tianwen-1 Mission to Mars - Close-Up of Zhurong’s Parachute
https://orbiterchspacenews.blogspot.com/2021/07/tianwen-1-mission-to-mars-close-up-of.html

Tianwen-1 Mission to Mars - New images from Zhurong
https://orbiterchspacenews.blogspot.com/2021/07/tianwen-1-mission-to-mars-new-images.html

Zhurong landing on Mars & Sounds of Zhurong’s descend onto Mars
https://orbiterchspacenews.blogspot.com/2021/06/zhurong-landing-on-mars-sounds-of.html

Zhurong rover and Tianwen-1 lander on Mars
https://orbiterchspacenews.blogspot.com/2021/06/zhurong-rover-and-tianwen-1-lander-on.html

Tianwen-1 Lander and Zhurong Rover seen by NASA’s Mars Reconnaissance Orbiter
https://orbiterchspacenews.blogspot.com/2021/06/tianwen-1-lander-and-zhurong-rover-seen.html

Zhurong is roving on Mars!
https://orbiterchspacenews.blogspot.com/2021/05/zhurong-is-roving-on-mars.html

Why the China Mars rover’s landing site has geologists excited & Zhurong’s first images from Mars
https://orbiterchspacenews.blogspot.com/2021/05/why-china-mars-rovers-landing-site-has.html

Tianwen-1 orbiter relays Zhurong rover’s data and images
https://orbiterchspacenews.blogspot.com/2021/05/tianwen-1-orbiter-relays-zhurong-rovers.html

Zhurong landed on Mars! The Tianwen-1 rover is on Utopia Planitia (Videos)
https://orbiterchspacenews.blogspot.com/2021/05/zhurong-landed-on-mars-tianwen-1-rover.html

China succeeds in landing its rover on Mars
https://orbiterchspacenews.blogspot.com/2021/05/china-succeeds-in-landing-its-rover-on.html

Related link:

For more information about China National Space Administration (CNSA), visit: http://www.cnsa.gov.cn/
 
Images, Video, Text, Credits: China National Space Administration (CNSA)/SciNews/Orbiter.ch Aerospace/Roland Berga.

Best regards, Orbiter.ch

Gaia finds parts of the Milky Way much older than expected


ESA - Gaia Mission patch.


March 24, 2022

Using data from ESA’s Gaia mission, astronomers have shown that a part of the Milky Way known as the ‘thick disc’ began forming 13 billion years ago, around 2 billion years earlier than expected, and just 0.8 billion years after the Big Bang.

The colour of the sky from Gaia’s Early Data Release 3

This surprising result comes from an analysis performed by Maosheng Xiang and Hans-Walter Rix, from the Max-Planck Institute for Astronomy, Heidelberg, Germany. They took brightness and positional data from Gaia’s Early Data Release 3 (EDR3) dataset and combined it with measurements of the stars’ chemical compositions, as given by data from China’s Large Sky Area Multi-Object Fiber Spectroscopic Telescope (LAMOST) for roughly 250 000 stars to derive their ages.

Milky Way edge-on view

They chose to look at sub giant stars. In these stars, energy has stopped being generated in the star’s core and has moved into a shell around the core. The star itself is transforming into a red giant star. Because the sub giant phase is a relatively brief evolutionary phase in a star’s life, it permits its age to be determined with great accuracy, but it’s still a tricky calculation.

How old are the stars?

The age of a star is one of the most difficult parameters to determine. It cannot be measured directly but must be inferred by comparing a star’s characteristics with computer models of stellar evolution. The compositional data helps with this. The Universe was born with almost exclusively hydrogen and helium. The other chemical elements, known collectively as metals to astronomers, are made inside stars, and exploded back into space at the end of a star’s life, where they can be incorporated into the next generation of stars. So, older stars have fewer metals and are said to have lower metallicity.

The LAMOST data gives the metallicity. Together, the brightness and metallicity allow astronomers to extract the star’s age from the computer models. Before Gaia, astronomers were routinely working with uncertainties of 20-40 percent, which could result in the determined ages being imprecise by a billion years or more.

Gaia’s EDR3 data release changes this. “With Gaia’s brightness data, we are able to determine the age of a sub giant star to a few percent,” says Maosheng. Armed with precise ages for a quarter of a million sub giant stars spread throughout the galaxy, Maosheng and Hans-Walter began the analysis.

Milky Way anatomy

Anatomy of the Milky Way

Our galaxy is made of different components. Broadly, these can be split into the halo and the disc. The halo is the spherical region surrounding the disc, and has traditionally been thought to be the oldest component of the galaxy. The disc is composed of two parts: the thin disc and the thick disc. The thin disc contains most of the stars that we see as the misty band of light in the night sky that we call the Milky Way. The thick disc is more than double the height of the thin disc but smaller in radius, containing only a few per cent of the Milky Way’s stars in the solar neighbourhood.

By identifying sub giant stars in these different regions, the researchers were able to build a timeline of the Milky Way’s formation – and that’s when they got a surprise.

Two phases in Milky Way history

The stellar ages clearly revealed that the formation of the Milky Way fell into two distinct phases. In the first phase, starting just 0.8 billion years after the Big Bang, the thick disc began forming stars. The inner parts of the halo may also have begun to come together at this stage, but the process rapidly accelerated to completion about two billion years later when a dwarf galaxy known as Gaia-Sausage-Enceladus merged with the Milky Way. It filled the halo with stars and, as clearly revealed by the new work, triggered the nascent thick disc to form the majority of its stars. The thin disc of stars which holds the Sun, was formed during the subsequent, second phase of the galaxy’s formation.

The analysis also shows that after the star-forming burst triggered by the merger with Gaia-Sausage-Enceladus, the thick disc continued to form stars until the gas was used up at around 6 billion years after the Big Bang. During this time, the metallicity of the thick disk grew by more than a factor of 10. But remarkably, the researchers see a very tight stellar age—metallicity relation, which indicates that throughout that period, the gas forming the stars was well-mixed across the whole disk. This implies that the early Milky Way’s disk regions must have been formed from highly turbulent gas that effectively spread the metals far and wide.

A timeline thanks to Gaia

The earlier formation age of the thick disc points to a different picture of our galaxy’s early history. “Since the discovery of the ancient merger with Gaia-Sausage-Enceladus, in 2018, astronomers have suspected that the Milky Way was already there before the halo formed, but we didn’t have a clear picture of what that Milky Way looked like. Our results provide exquisite details about that part of the Milky Way, such as its birthday, its star-formation rate and metal enrichment history. Putting together these discoveries using Gaia data is revolutionising our picture of when and how our galaxy was formed.” says Maosheng.

And we may not yet be looking far enough into the Universe to see similar galactic discs forming. An age of 13 billion years corresponds to a redshift of 7, where redshift is a measure of how far away a celestial object is, and so how long its light has taken to cross space and reach us.

Gaia's Milky Way discoveries

New observations could come in the near future as the James Webb Space Telescope has been optimised to see the earliest Milky Way-like galaxies in the Universe. And on 13 June this year, Gaia will release its full third data release (Gaia DR3). This catalogue will include spectra and derived information like ages and metallicity, making studies like Maosheng’s even easier to conduct.

“With each new analysis and data release, Gaia allows us to piece together the history of our galaxy in even more unprecedented detail. With the release of Gaia DR3 in June, astronomers will be able to enrich the story with even more details,” says Timo Prusti, Gaia Project Scientist for ESA.

“A time-resolved picture of our Milky Way’s early formation history” by Maosheng Xiang and Hans-Walter Rix is published in Nature. doi https://www.nature.com/articles/s41586-022-04496-5%20

Related links:

Early Data Release 3 (EDR3): https://www.esa.int/Science_Exploration/Space_Science/Gaia/Gaia_s_new_data_takes_us_to_the_Milky_Way_s_anticentre_and_beyond

Gaia: https://www.esa.int/Science_Exploration/Space_Science/Gaia

Images, Video, Text, Credits: ESA/Gaia/DPAC; CC BY-SA 3.0 IGO. Acknowledgement: A. Moitinho/Stefan Payne-Wardenaar/MPIA/NASA/JPL-Caltech/ESA/ATG medialab.

Greetings, Orbiter.ch

Astronauts Complete Spacewalk to Install Station Upgrades


EVA - Extra Vehicular Activities patch.


March 24, 2022


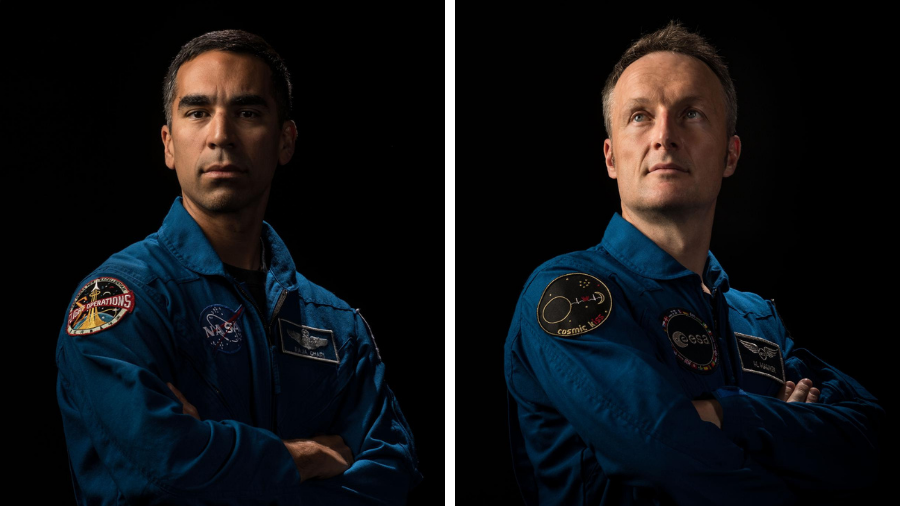
Image above: Spacewalkers Raja Chari and Matthias Maurer will exit the station for a six-and-a-half-hour spacewalk on Wednesday, March 23, 2022. Image Credit: NASA.

Expedition 66 Flight Engineers Raja Chari of NASA and Matthias Maurer of ESA (European Space Agency) concluded their spacewalk at 3:26 p.m. EDT after 6 hours and 54 minutes in preparation for upcoming solar array installation.


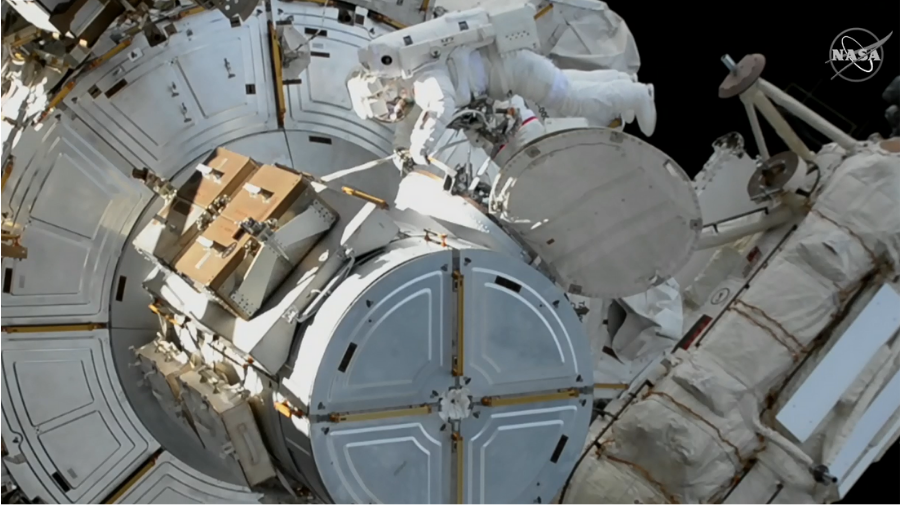
Image above: Expedition 66 Flight Engineers Raja Chari of NASA and Matthias Maurer of ESA (European Space Agency) began a spacewalk at 8:32 a.m. EDT to install hoses on a Radiator Beam Valve Module to support temperature regulation on the International Space Station. Image Credit: NASA TV.

Maurer and Chari completed their major objective for today to install hoses on a Radiator Beam Valve Module that routes ammonia through the station’s heat-rejecting radiators to keep systems at the proper temperature. The crew members also installed a power and data cable on the Columbus module’s Bartolomeo science platform, replaced an external camera on the station’s truss, and conducted other upgrades to station hardware. The pair deferred a few secondary tasks, such as torque resets and cable routing, to a future spacewalk.


Image above: Astronauts Raja Chari and Matthias Maurer are pictured replacing an external high-definition camera during a 6-hour 54-minute spacewalk today. Image Credit: NASA TV.

It was the 248th spacewalk in support of space station assembly, upgrades and maintenance, and was the second in Chari’s career and the first for Maurer. Chari and Maurer are in the midst of a planned six-month science mission living and working aboard the microgravity laboratory to advance scientific knowledge and demonstrate new technologies for future human and robotic exploration missions as part of NASA’s Moon and Mars exploration approach, including lunar missions through NASA’s Artemis program.

Related links:

Expedition 66: https://www.nasa.gov/mission_pages/station/expeditions/expedition66/index.html

Canadarm2 robotics arm: https://www.nasa.gov/mission_pages/station/structure/elements/mobile-servicing-system.html

Space Station Research and Technology: https://www.nasa.gov/mission_pages/station/research/overview.html

International Space Station (ISS): https://www.nasa.gov/mission_pages/station/main/index.html

Images (mentioned), Text, Credits: NASA/Heidi Lavelle.

Best regards, Orbiter.ch

mardi 22 mars 2022

Station Go for Spacewalk Ahead of Upcoming Crew Departure


ISS - Expedition 66 Mission patch.


March 22, 2022

Mission managers have given the go for two astronauts to exit the International Space Station on Wednesday for a six-and-a-half-hour spacewalk. Meanwhile, three Expedition 66 crew members are getting ready for their return to Earth at the end of the month.

Flight Engineers Raja Chari of NASA and Matthias Maurer of ESA (European Space Agency) began Tuesday morning with standard medical checkups the day before their spacewalk. The duo had an ear exam and measured heart and breathing rate, blood pressure, and temperature. Afterward, Chari and Maurer staged their U.S. spacesuits and readied their spacewalking tools inside the U.S. Quest airlock.


Image above: (From left) Astronauts Raja Chari and Matthias Maurer will exit the space station on Wednesday for a 6.5-hour maintenance spacewalk. Image Credit: NASA.

During the afternoon, the spacewalking pair were joined by NASA astronauts Kayla Barron and Tom Marshburn for a procedures review with engineers on the ground. Barron and Marshburn will also be on robotics duty commanding the Canadarm2 robotics arm to assist the spacewalkers during Wednesday’s excursion. Chari and Maurer set their spacesuits to battery power at 8:50 a.m. EDT signifying the start of their spacewalk. Their main objective is to install thermal system and electronics components on the outside of the space station. Live NASA TV coverage begins at 7:30 a.m. on NASA Television, the NASA app and the agency’s website.

The next major event at the orbital lab will be on March 30 when NASA Flight Engineer Mark Vande Hei returns to Earth with Roscosmos cosmonauts Anton Shkaplerov and Pyotr Dubrov. The trio will undock from the Rassvet module inside the Soyuz MS-19 crew ship and parachute to a landing in Kazakhstan about three-and-a-half hours later. The two cosmonauts practiced Soyuz descent procedures and loaded cargo and personal items inside the vehicle. Vande Hei, who will land with a NASA-record breaking 355 continuous days in space, focused mainly on science today studying space archeology and glass optics.

International Space Station (ISS). Animation Credit: ESA

The station’s three newest crew members are in their first full week on the orbiting lab and continue their station familiarization activities. Cosmonaut Oleg Artemyev, on his third space station mission, and first time space-flyers Sergey Korsakov and Denis Matveev will spend the next few days getting used to life on orbit.

Related links:

NASA Television: https://www.nasa.gov/nasalive

Expedition 66: https://www.nasa.gov/mission_pages/station/expeditions/expedition66/index.html

Canadarm2 robotics arm: https://www.nasa.gov/mission_pages/station/structure/elements/mobile-servicing-system.html

Rassvet module: https://www.nasa.gov/mission_pages/station/structure/elements/rassvet

Space archeology: https://www.nasa.gov/mission_pages/station/research/experiments/explorer/Investigation.html?#id=8684

Glass optics: https://www.nasa.gov/mission_pages/station/research/experiments/explorer/Investigation.html?#id=8383

Space Station Research and Technology: https://www.nasa.gov/mission_pages/station/research/overview.html

International Space Station (ISS): https://www.nasa.gov/mission_pages/station/main/index.html

Image (mentioned), Animation (mentioned), Text, Credits: NASA/Mark Garcia.

Greetings, Orbiter.ch

ATLAS seeks out unusual signatures of long-lived particles


CERN - European Organization for Nuclear Research logo.


March 22, 2022

Physicists at the ATLAS experiment are on the hunt for new, long-lived particles to help explain several outstanding mysteries of our Universe


Image above: ATLAS event display for a data event with a pair of “displaced jets”, which are narrow, largely trackless and have most of their energy in the hadronic part of the calorimeter. (Image: CERN).

High-energy collisions at the Large Hadron Collider (LHC) allow researchers to clearly study heavy Standard Model particles, like the Higgs boson, that decay almost immediately at the LHC collision point. However, new long-lived particles (LLPs) could travel sizeable distances through the ATLAS detector before decaying.

Studying the decay of any particle is a complex task, but it is usually made much easier by assuming that it decayed near the LHC collision point. This leaves LLPs in a blind spot, as they could decay anywhere in the detector. To ensure no stone is left unturned, ATLAS physicists have devised a range of new strategies to look for LLPs with various possible characteristics.

The hunt for right-handed neutrinos

Neutrinos have long puzzled physicists, as they have only ever been observed to be “left-handed” (i.e. their spin and momentum are opposed), while all other particles can also be observed in “right-handed” states. One possibility is that right-handed neutrinos exist but are very heavy, and therefore harder to produce in nature. These particles – called “heavy neutral leptons” (HNLs) – could also explain why neutrinos are so light.

In a new search for HNLs, ATLAS physicists looked for leptons originating from a common point a short distance from the collision point. The HNL could have decayed to a mixture of electrons, muons and missing energy. Using the decay products, they reconstructed the possible HNL mass and were able to set limits on masses between 3 and ~15 GeV. They also reported on HNL decays to electron–muon pairs for the very first time!

Harnessing the power of machine learning

If a new, neutral LLP were to decay to quarks in the outer layers of the calorimeter, it would leave behind sprays of collimated particles called “displaced” jets. These would leave an unusual signature in the detector: the jets would have no associated particle trajectories and would be very narrow compared to their Standard Model counterparts (see event display).

ATLAS researchers have exploited the uncommon characteristics of displaced jets to search for pairs of neutral LLPs. They developed novel machine-learning methods to distinguish displaced jets from background interactions. No significant excess of events has been spotted so far.

But what if the neutral LLP decays to leptons instead of quarks? “Dark photons” are a type of LLP believed to behave this way, and would leave behind collimated sprays of leptons in the detector, called “lepton-jets”. ATLAS’s newest search for dark photons uses machine-learning techniques that exploit patterns of raw energy deposits in each layer of the detector – a first for the collaboration. Although no excess of events was seen, physicists set stringent new limits on the existence of dark photons and were able to probe dark-photon decays to electrons for the very first time!

Following the steps of charged LLPs

When searching for new particles, physicists have to look for their decay products – or do they? If a heavy charged LLP exists, it would leave abnormally large energy deposits in the ATLAS tracking detector. This is an exceptional case where physicists could actually detect a new particle directly.


Graphic above: Result of the ATLAS search for a heavy charged LLP. The observed data (black) agree with the Standard Model expectation (blue line), except for a small excess of events in a high-energy and high-mass region (above 1000 GeV). (Image: ATLAS collaboration/CERN).

However, predicting the Standard Model background processes in this search is very challenging. To tackle the problem, ATLAS physicists employed a sophisticated “data-driven” method using tracks with regular energy deposits for comparison. The observed data agree with the Standard Model expectation, except for a small excess of events in a high-energy and high-mass region (see figure). Although intriguing, the measurements made indicate that none of the candidate events match the heavy new particle hypothesis. New searches in the works, and additional data, could shed more light on it.

Into Run 3

At the heart of these analyses is one key question: what if new particles are hiding from standard searches? ATLAS researchers have developed novel, creative ways to explore the rich diversity of possible LLP decays. The search continues, with Run 3 of the LHC promising new data and new innovations to further this exciting programme of research.

Note:

CERN, the European Organization for Nuclear Research, is one of the world’s largest and most respected centres for scientific research. Its business is fundamental physics, finding out what the Universe is made of and how it works. At CERN, the world’s largest and most complex scientific instruments are used to study the basic constituents of matter — the fundamental particles. By studying what happens when these particles collide, physicists learn about the laws of Nature.

The instruments used at CERN are particle accelerators and detectors. Accelerators boost beams of particles to high energies before they are made to collide with each other or with stationary targets. Detectors observe and record the results of these collisions.

Founded in 1954, the CERN Laboratory sits astride the Franco–Swiss border near Geneva. It was one of Europe’s first joint ventures and now has 23 Member States.

Related links:

Large Hadron Collider (LHC): https://home.cern/science/accelerators/large-hadron-collider

Large Hadron Collider beauty (LHCb): https://lhcb-public.web.cern.ch/

ATLAS: https://home.cern/science/experiments/atlas

For more information about European Organization for Nuclear Research (CERN), Visit: https://home.cern/

Image (mentioned), Graphic (mentioned), Text, Credits: CERN/By ATLAS collaboration.

Best regards, Orbiter.ch

NASA Finds 2022 Arctic Winter Sea Ice 10th-Lowest on Record


NASA - Goddard Space Flight Center logo.


March 22, 2022

Arctic sea ice appeared to have hit its annual maximum extent on Feb. 25 after growing through the fall and winter. This year’s wintertime extent is the 10th-lowest in the satellite record maintained by the National Snow and Ice Data Center, one of NASA’s Distributed Active Archive Centers.


Animation above: This image visualizes wintertime sea ice change in the Arctic using data provided by the Japan Aerospace Exploration Agency’s Global Change Observation Mission 1st-Water “SHIZUKU” satellite, which is part of a NASA-led partnership to operate several Earth-observing satellites. The full video can be accessed at https://svs.gsfc.nasa.gov/4985. Animation Credits: NASA's Scientific Visualization Studio.

Arctic sea ice extent peaked at 5.75 million square miles (14.88 million square kilometers) and is roughly 297,300 square miles (770,000 square kilometers) below the 1981-2010 average maximum – equivalent to missing an area of ice slightly larger than Texas and Maine combined. This maximum ties with 2015 as the third earliest on record.

Sea ice waxes and wanes with the seasons every year. In the Arctic, it reaches its maximum extent around March after growing through the colder months, and shrinks to its minimum extent in September after melting through the warmer months. In the Southern Hemisphere, Antarctic sea ice follows an opposite cycle.

To estimate sea ice extent, satellite sensors gather sea ice data that are processed into daily images, each image grid cell spanning an area of roughly 15 miles by 15 miles (25 kilometers by 25 kilometers). Scientists then use these images to estimate the extent of the ocean where sea ice covers at least 15% of the water.


Image above: This image shows the average concentration of Arctic sea ice on Feb. 25, 2022. The yellow outline shows the median sea ice extent for the month of March, when the ice generally reaches its maximum extent, as observed by satellites from 1981 to 2010. A median is the middle value. That is, half of the extents were larger than the line, and half were smaller. Image Credits: Joshua Stevens/NASA Earth Observatory.

Since satellites began reliably tracking sea ice in 1979, maximum extents in the Arctic have declined at a pace of about 13% per decade, with minimum extents declining at about 2.7% per decade. These trends are linked to warming caused by human activities such as emitting carbon dioxide, which traps heat in the atmosphere and causes temperatures to rise. NASA’s analysis also shows the Arctic is warming about three times faster than other regions.

This February, Antarctic sea ice dropped to a record-low minimum extent. But unlike in the Arctic, this sea ice has shown irregular ups and downs mainly because of the geographical features that surround it. Winds and ocean currents specifically linked to the Southern Ocean and Antarctica have a strong influence on sea ice extent.


Graphic above: This graph shows Arctic daily sea ice extent in 2022, 2021, and 2012 compared to the 1981-2010 average. This year’s annual maximum extent was reached on Feb. 25. Graphic Credits: Joshua Stevens/NASA Earth Observatory.

Sea ice in the Arctic is surrounded by land, whereas sea ice in the Antarctic is surrounded only by ocean and can thus spread out more freely. Overall, the Antarctic sea ice record shows a slightly upward – but nearly flat – trend or increase.

Arctic Sea Ice Maximum 2022

Gains in Antarctic sea ice are not large enough to offset the losses of the Arctic. The ice in both regions helps regulate global temperatures. Even if Antarctic gains balanced sea ice levels globally, Arctic sea ice losses could still contribute to further regional and global warming.

Related links:

National Snow and Ice Data Center: https://nsidc.org/

Climate: https://www.nasa.gov/subject/3127/climate

Goddard Space Flight Center (GSFC): https://www.nasa.gov/centers/goddard/home/index.html

Animation (mentioned), Image (mentioned), Video, Text, Credits: NASA/GSFC/By Roberto Molar Candanosa/SciNews.

Greetings, Orbiter.ch

ASACUSA sees surprising behaviour of hybrid matter–antimatter atoms in superfluid helium


CERN - European Organization for Nuclear Research logo.


March 22, 2022

The result may open doors to several lines of research in particle physics and beyond

Masaki Hori, ASACUSA co-spokesperson (Image: CERN)

A hybrid matter­­–antimatter helium atom containing an antiproton, the proton’s antimatter equivalent in place of an electron, has an unexpected response to laser light when immersed in superfluid helium, reports the ASACUSA collaboration at CERN. The result, described in a paper published today in the journal Nature, may open doors to several lines of research.

“Our study suggests that hybrid matter–antimatter helium atoms could be used beyond particle physics, in particular in condensed-matter physics and perhaps even in astrophysics experiments,” says ASACUSA co-spokesperson Masaki Hori. “We have arguably made the first step in using antiprotons to study condensed matter.”

The ASACUSA collaboration is well used to making hybrid matter–antimatter helium atoms to determine the antiproton’s mass and compare it with that of the proton. These hybrid atoms contain an antiproton and an electron around the helium nucleus (instead of two electrons around a helium nucleus) and are made by mixing antiprotons produced at CERN’s antimatter factory with a helium gas that has a low atomic density and is kept at low temperature.

ASACUSA experiment (Image: CERN)

Low gas densities and temperatures have played a key role in these antimatter studies, which involve measuring the response of the hybrid atoms to laser light in order to determine their light spectrum. High gas densities and temperatures result in spectral lines, caused by transitions of the antiproton or electron between energy levels, that are too broad, or even obscured, to allow the mass of the antiproton relative to that of the electron to be determined.

This is why it came as surprise to the ASACUSA researchers that, when they used liquid helium, which has a much higher density than gaseous helium, in their new study, they saw a decrease in the width of the antiproton spectral lines.

Moreover, when they decreased the temperature of the liquid helium to values below the temperature at which the liquid becomes a superfluid, i.e. flows without any resistance, they found an abrupt further narrowing of the spectral lines.

“This behaviour was unexpected,” says Anna Sótér, who was the principal PhD student working on the experiment and is now an assistant professor at ETHZ. “The optical response of the hybrid helium atom in superfluid helium is starkly different to that of the same hybrid atom in high-density gaseous helium, as well as that of many normal atoms in liquids or superfluids.”

The researchers think that the surprising behaviour observed is linked to the radius of the electronic orbital, i.e. the distance at which the hybrid helium atom’s electron is located. In contrast to that of many normal atoms, the radius of the hybrid atom’s electronic orbital changes very little when laser light is shone on the atom and thus does not affect the spectral lines even when the atom is immersed in superfluid helium. However, further studies are needed to confirm this hypothesis.

The result has several ramifications. Firstly, researchers may create other hybrid helium atoms, such as pionic helium atoms, in superfluid helium using different antimatter and exotic particles, to study their response to laser light in detail and measure the particle masses. Secondly, the substantial narrowing of the lines in superfluid helium suggests that hybrid helium atoms could be used to study this form of matter and potentially other condensed-matter phases. Finally, the narrow spectral lines could in principle be used to search for cosmic antiprotons or antideuterons (a nucleus made of an antiproton and an antineutron) of particularly low velocity that hit the liquid or superfluid helium that is used to cool experiments in space or in high-altitude balloons. However, numerous technical challenges must be overcome before the method becomes complementary to existing techniques for searching for these forms of antimatter.

Note:

CERN, the European Organization for Nuclear Research, is one of the world’s largest and most respected centres for scientific research. Its business is fundamental physics, finding out what the Universe is made of and how it works. At CERN, the world’s largest and most complex scientific instruments are used to study the basic constituents of matter — the fundamental particles. By studying what happens when these particles collide, physicists learn about the laws of Nature.

The instruments used at CERN are particle accelerators and detectors. Accelerators boost beams of particles to high energies before they are made to collide with each other or with stationary targets. Detectors observe and record the results of these collisions.

Founded in 1954, the CERN Laboratory sits astride the Franco–Swiss border near Geneva. It was one of Europe’s first joint ventures and now has 23 Member States.

Related links:

Nature: https://www.nature.com/articles/s41586-022-04440-7

ASACUSA: https://home.cern/science/experiments/asacusa

CERN’s antimatter factory: https://home.cern/science/accelerators/antiproton-decelerator

Antimatter: https://home.cern/science/physics/antimatter

Pionic helium atoms: https://home.cern/news/news/physics/asacusa-researchers-create-and-study-new-exotic-atom-psi

For more information about European Organization for Nuclear Research (CERN), Visit: https://home.cern/

Images (mentioned), Text, Credit: European Organization for Nuclear Research (CERN).

Best regards, Orbiter.ch